This article is part of a series of 9 where I am talking about storage benchmarks performed on Microsoft Azure and on-premises. For a better understanding please make sure you read also the other parts:
- Describe what does the Iometer benchmarks will consist of.
- Describe how I configured the Azure VM and the benchmark results for the A3 Standard VM using a single disk hosted by Standard Locally Redundant Storage (LRS).
- Describe how I configured the Azure VM and the benchmark results for the A3 Standard VM using multiple (eight) disks in a RAID-0 (striped) configuration hosted by Standard Locally Redundant Storage.
- Describe how I configured the Azure VM and the benchmark results for the DS3 Standard VM using a single Premium P10 disk hosted by Premium Locally Redundant Storage (LRS).
- Describe how I configured the Azure VM and the benchmark results for the DS3 Standard VM using a single Premium P30 disk hosted by Premium Locally Redundant Storage (LRS).
- Describe how I configured the Azure VM and the benchmark results for the DS3 Standard VM using multiple (two) disks in a RAID-0 (striped) configuration hosted by Premium P30 Locally Redundant Storage.
- Describe how I configured the Azure VM and the benchmark results for the DS3 Standard VM using multiple (eight) disks in a RAID-0 (striped) configuration hosted by Standard Locally Redundant Storage.
- Describe how I configured the Hyper-V on-premises VM and the benchmark results using local HDD and SSD.
- IOPS benchmark detailed conclusions (on-premises and Azure IaaS).
On-Premises VM using HDD and SSD – setup and benchmark results
The purpose with the on-premises benchmarks is to see how much difference we have compared with Azure.
This time I will present the benchmark results for:
- Western Digital Scorpio Black WD5000BEKT 500GB HDD (the consumer on-premises “equivalent” of Azure Standard storage)
- Samsung 840 Pro Series 500 GB SSD (the consumer on-premises “equivalent” of Azure Premium storage).
The on-premises benchmark have been performed with and without 500 IOPS QOS. This will allow us to understand what can the storage provide native (without limitations) and also see how much the 500 IOPS limit is affecting the performance.
The on-premises setup is based on Hyper-V and will have a very close configuration as the Azure A3 Standard VMs:
- The operating system virtual disk and the temporary storage will be hosted by separated physical disks (the D:\ volume will be hosted by SSD);
- The additional virtual disk mounted to the on-premises VM (F:\ volume) will be used for benchmarks and will be hosted:
- by a Western Digital Scorpio Black WD5000BEKT 500GB HDD (the consumer on-premises “equivalent” of Azure Standard storage);
- by a Samsung 840 Pro Series 500 GB SSD (the consumer on-premises “equivalent” of Azure Premium storage);
- VM OS: Windows Server 2012 R2 Datacenter Edition
- CPU Cores: 4
- Memory: 7 GB
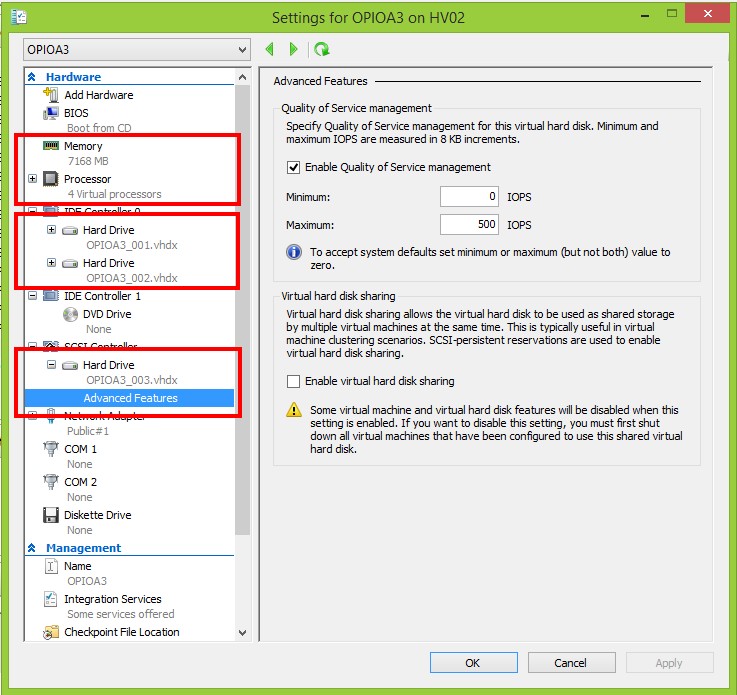
Benchmark results (OPIOA3 VM on-premises, F: volume on single disk with no QOS, hosted by a Western Digital Scorpio Black WD5000BEKT 500GB HDD)
Let’s start first by placing the OPIOA3_003.VHDX on a Western Digital Scorpio Black WD5000BEKT 500GB HDD and see what results we have with QOS storage disabled.
The Iometer results can be downloaded from here.
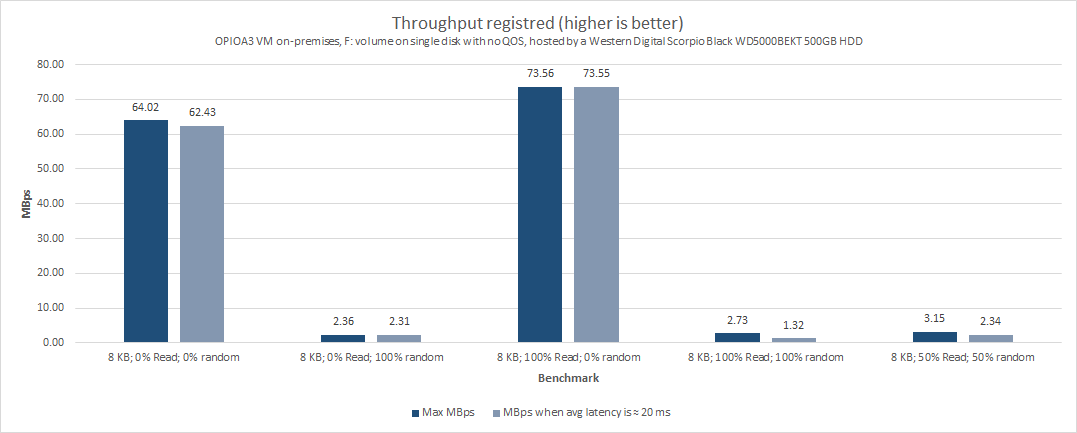
Very important to be noticed is the low throughput was registered only for the benchmarks where random I/O operations where performed (2.36 MBps for the 8 KB; 0% Read; 100% random; benchmark). If we take in consideration the 20 ms recommended latency, we can see in some cases the throughput is not that close to the maximum registered value, which indicates clearly the limits are mainly coming from the physical storage.
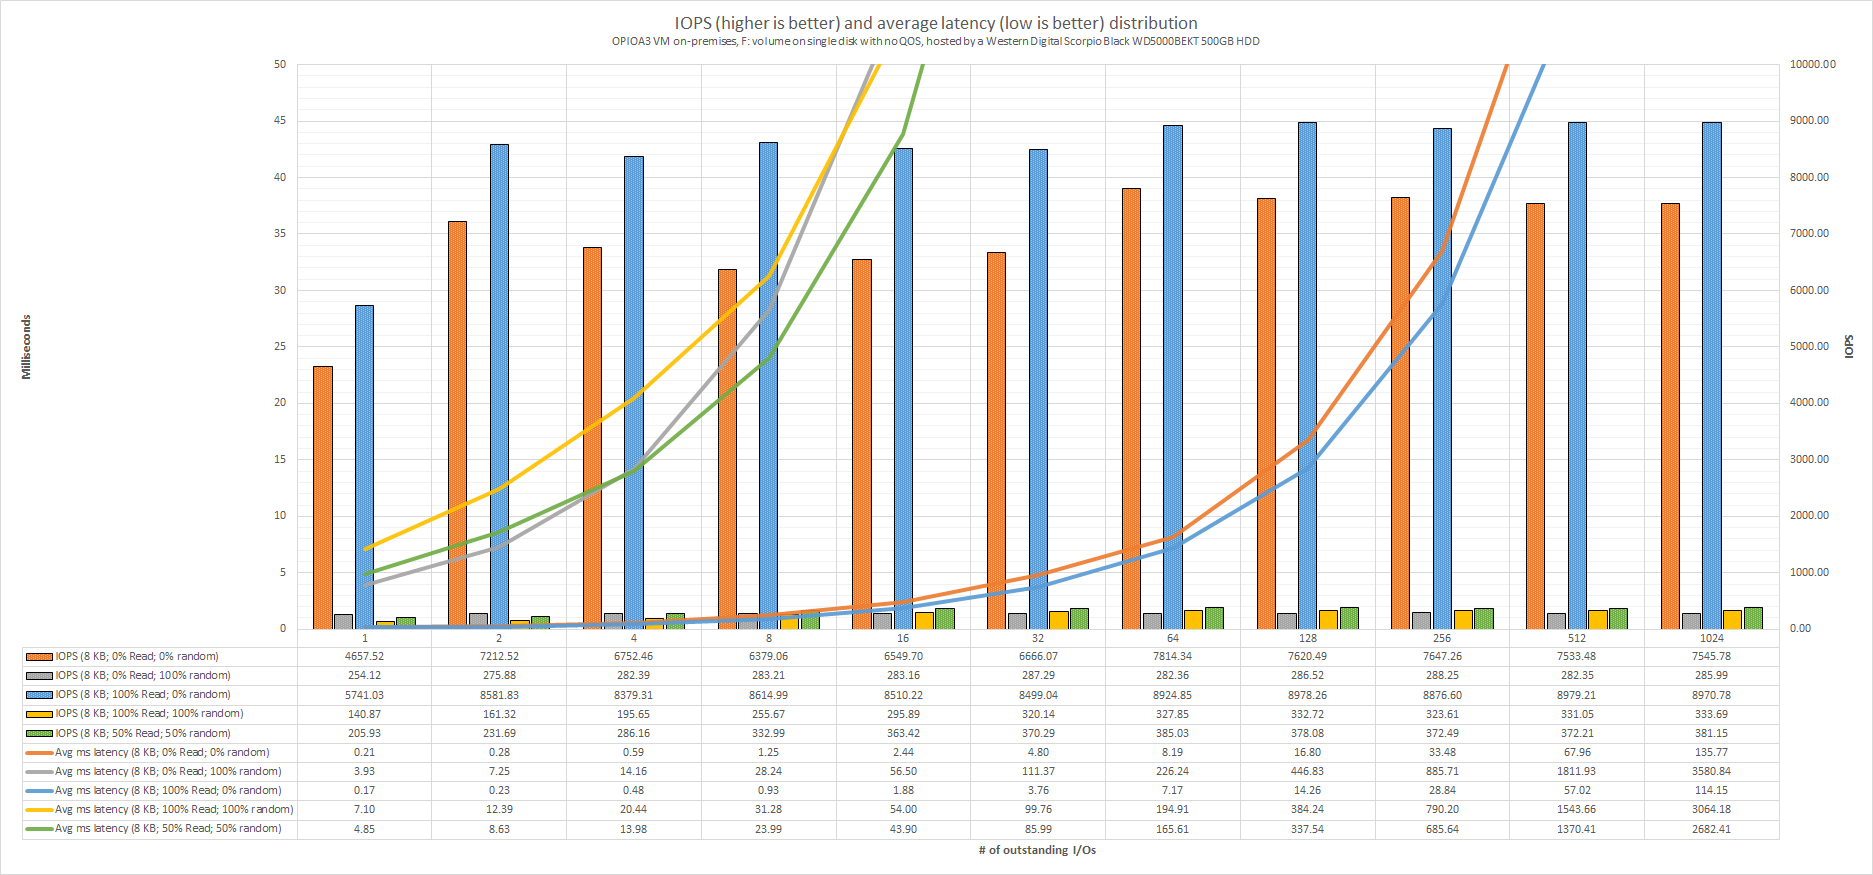
The above chart indicates the IOPS and average latency distribution across different workloads (# of Outstanding I/Os). If we take in consideration the 20 ms recommended latency, we can say:
- when frequent random I/Os are encountered whatever is higher than 8 outstanding I/Os (very light workloads) will result in application performance degradation. As can be seen the average latency is growing (up to 3.6 seconds) and gets way outside the chart limits.
- when exclusive sequential I/Os are encountered whatever is higher than 128 outstanding I/Os (relative heavy workloads) will result in application performance degradation. As can be seen the average latency is growing (up to 135 ms) and gets outside the chart limits.
Even if the performance is not looking impressive at all, keep in mind – this is in general the performance that can be obtained using consumer HDDs (the enterprise 10K RPM HDDs are not that far away from these results). Luckily benchmarks like 8 KB; 0% Read; 100% random; are representing the extreme application usage behavior. In general the number of read operations is a bit higher than the writes and the percentage of random I/O varies (is not all the time 100% random). The above chart also confirms why disk defragmentation should be considered part of regular maintenance plan for the HDDs (performance is improved because the defragmentation will increase the sequential I/Os to occur).
Benchmark results (OPIOA3 VM on-premises, F: volume on single disk with QOS enabled set to maximum 500 IOPS, hosted by a Western Digital Scorpio Black WD5000BEKT 500GB HDD)
Now let’s see the results when the OPIOA3_003.VHDX is hosted by the same HDD (Western Digital Scorpio Black WD5000BEKT 500GB HDD), but this time QOS storage is set to max 500 IOPS.
The Iometer results can be downloaded from here.
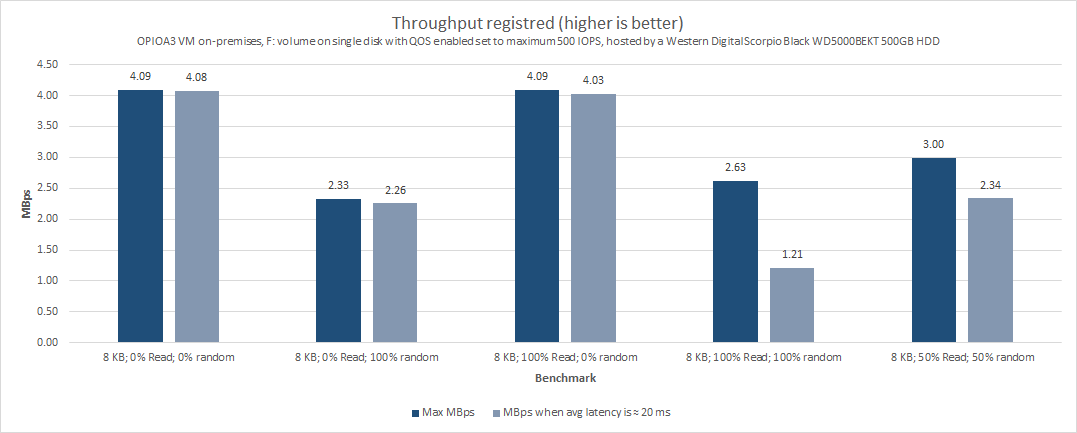
In the above chart you can see the registered throughput. We don’t have that much difference from the non-QOS benchmark results in terms of random I/Os. However the 500 IOPS limit doesn’t allow to reach speeds higher than 4.09 MBps. If we take in consideration the 20 ms recommended latency, we can see in some cases the throughput is not that close to the maximum registered value, which indicates clearly the limits are mainly coming from the physical storage.
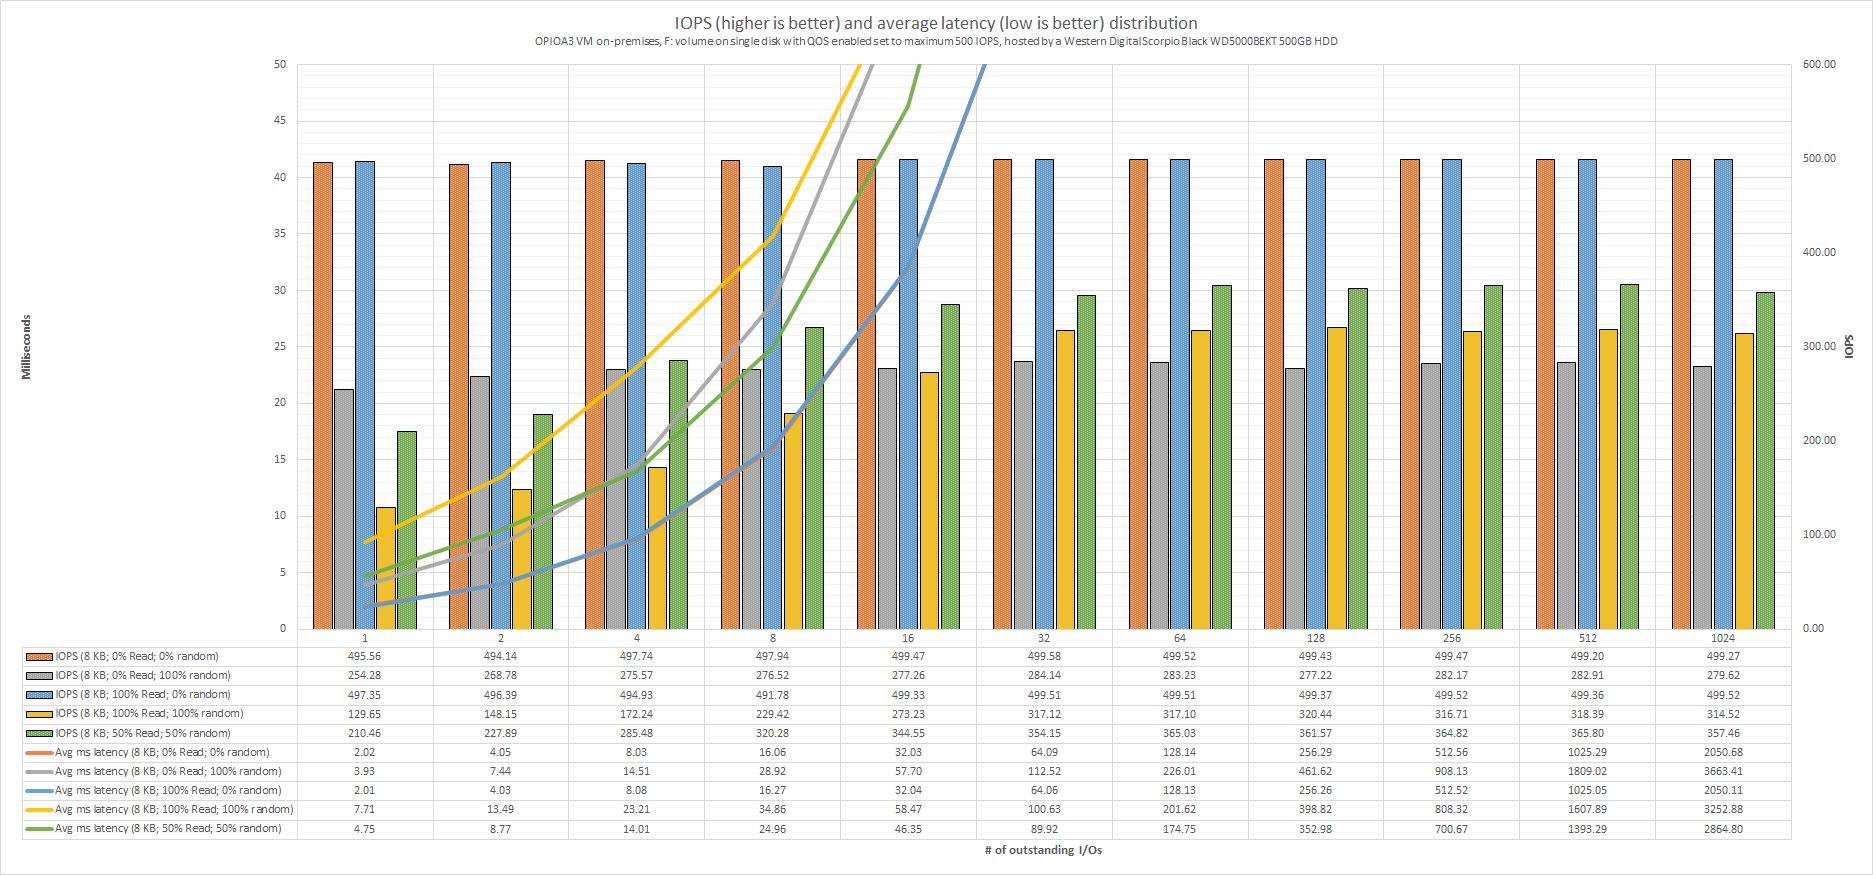
The above chart indicates the IOPS and average latency distribution across different workloads (# of Outstanding I/Os). If we take in consideration the 20 ms recommended latency, we can say whatever is higher than 8 (sometimes 4) outstanding I/Os (very light workloads) will result in application performance degradation. As can be seen the average latency is growing (up to 3.6 seconds) and gets way outside the chart limits.
If we compare it with the non-QOS benchmark results we can clearly see the 500 IOPS limits will significantly reduce the performance of the sequential operations (the only operations who are decent in terms of speed). In such setup (VHD with 500 IOPS QOS and hosted by a single consumer class HDD) the regular disk defragmentation maintenance plan will not change too much the results (the defragmentation is increasing the sequential I/Os to occur, but these operations will be limited to 500 IOPS / ≈4.09 MBps).
Benchmark results (OPIOA3 VM on-premises, F: volume on single disk with no QOS, hosted by a Samsung 840 Pro Series 500 GB SSD)
Previously we’ve seen the results obtained using consumer class HDDs. Now we will look into the performance results obtained using consumer class SSDs.
The Iometer results can be downloaded from here.
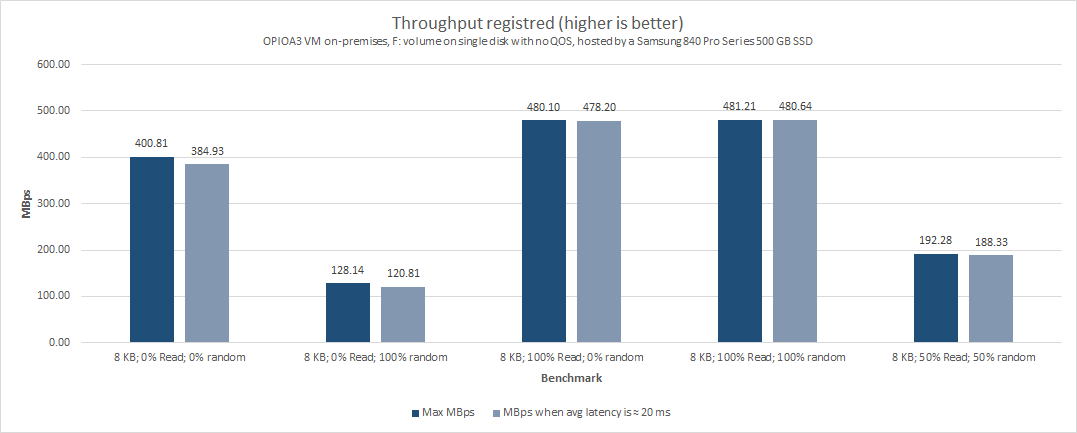
In the above chart is presented the registered throughput. As in the case of HDDs, the benchmarks where random I/O operations are performed are registering the lowest throughput, but 128.14 MBps at 8 KB; 0% Read; 100% random is by far not bad performance. If we take in consideration the 20 ms recommended latency, we can see in some cases the throughput is not that close to the maximum registered value, which indicates clearly the limits are mainly coming from the physical storage device.
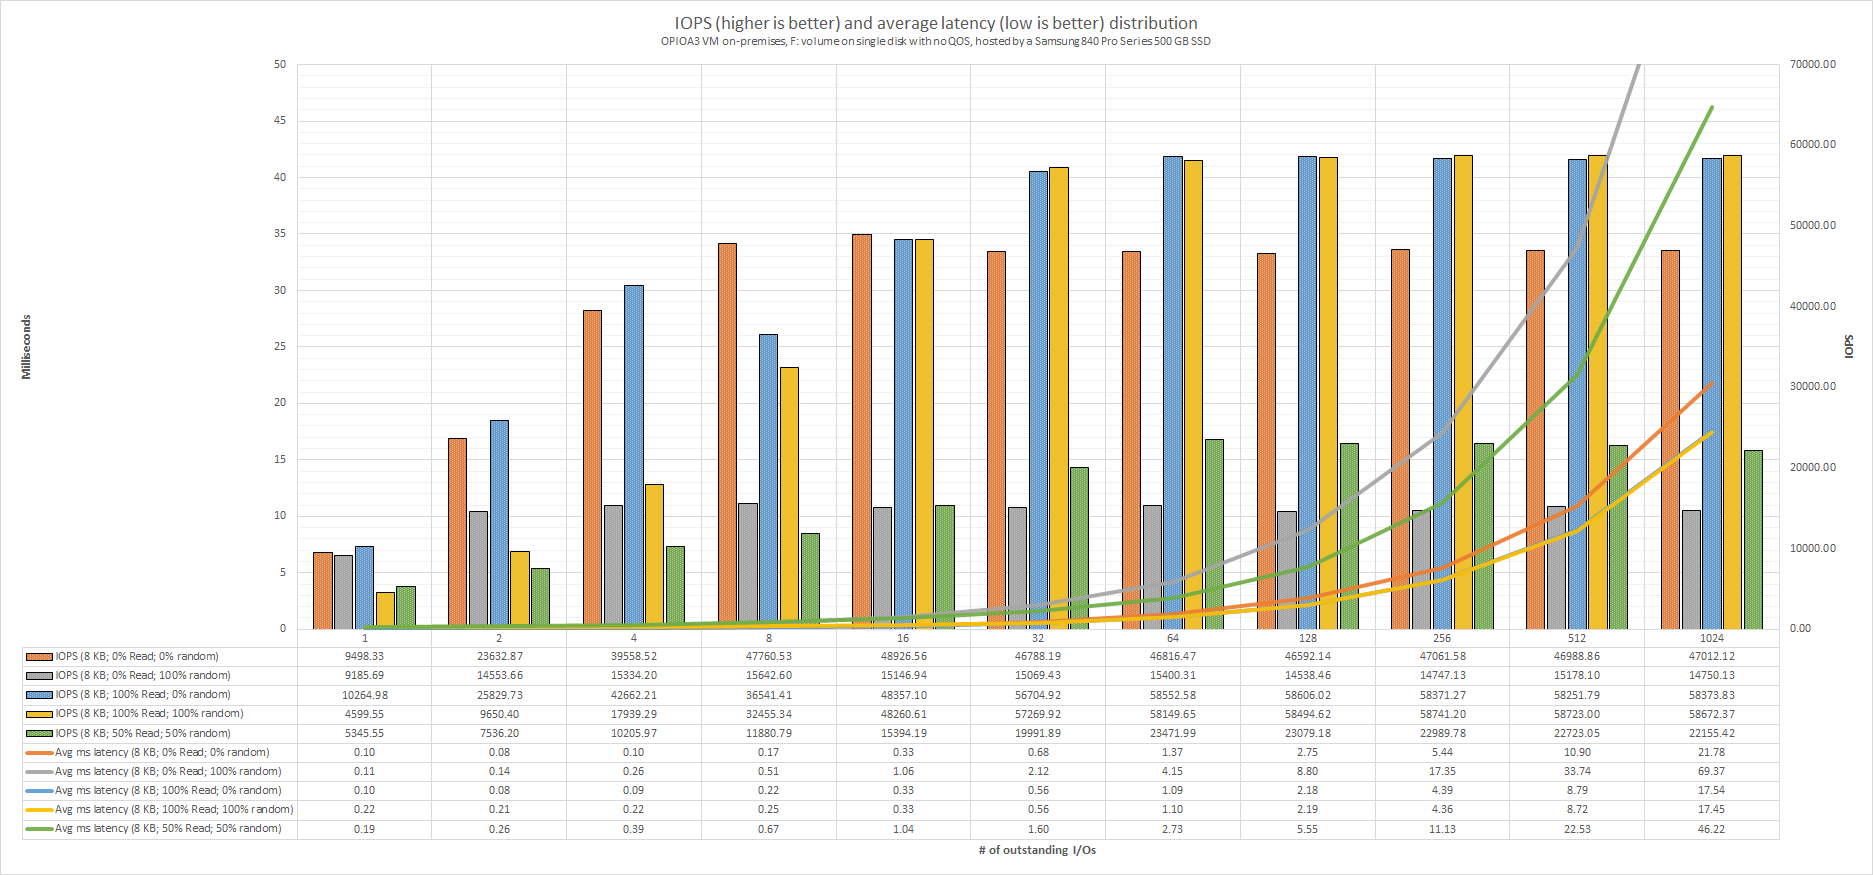
The above chart indicates the IOPS and average latency distribution across different workloads (# of Outstanding I/Os). If we take in consideration the 20 ms recommended latency, we can say whatever is higher than 256 (sometimes 1024) outstanding I/Os (heavy and very heavy workloads) will result in application performance degradation. As can be seen the average latency is growing (up to 69.37 ms) and gets a bit outside the chart limits. Not bad at all!
Benchmark results (OPIOA3 VM on-premises, F: volume on single disk with QOS enabled set to maximum 500 IOPS, hosted by a Samsung 840 Pro Series 500 GB SSD)
Now let’s see the results when the OPIOA3_003.VHDX is hosted by the same SSD (Samsung 840 Pro Series 500 GB SSD), but this time QOS storage is set to max 500 IOPS.
The Iometer results can be downloaded from here.
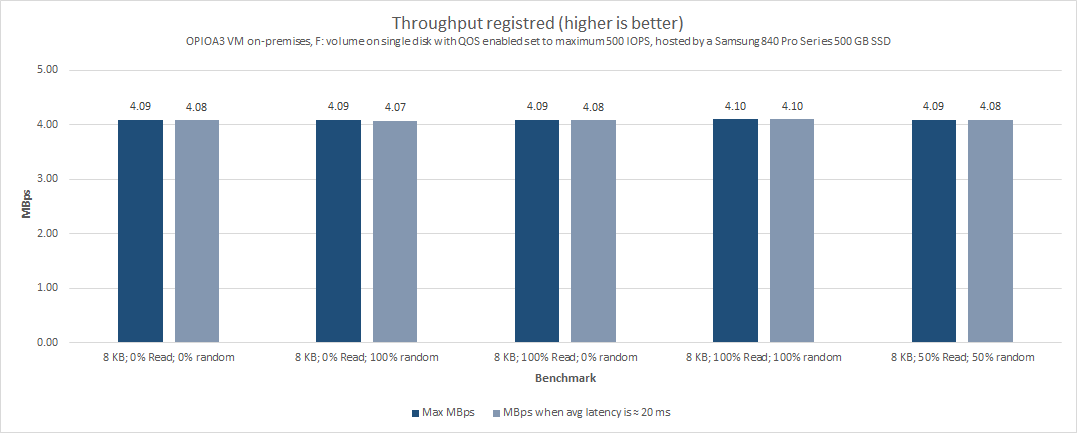
In the above chart you can see the registered throughput. Very important to be noticed is the fact the 500 IOPS limit per disk doesn’t allow to reach speeds higher than 4.10 MBps (at 15.99 ms average latency).
If we take in consideration the 20 ms recommended latency, we can see all the time the registered throughput is close to the maximum registered value, which indicates clearly the limits are mainly coming from the QOS limits applied by Hyper-V (not caused by the physical storage).
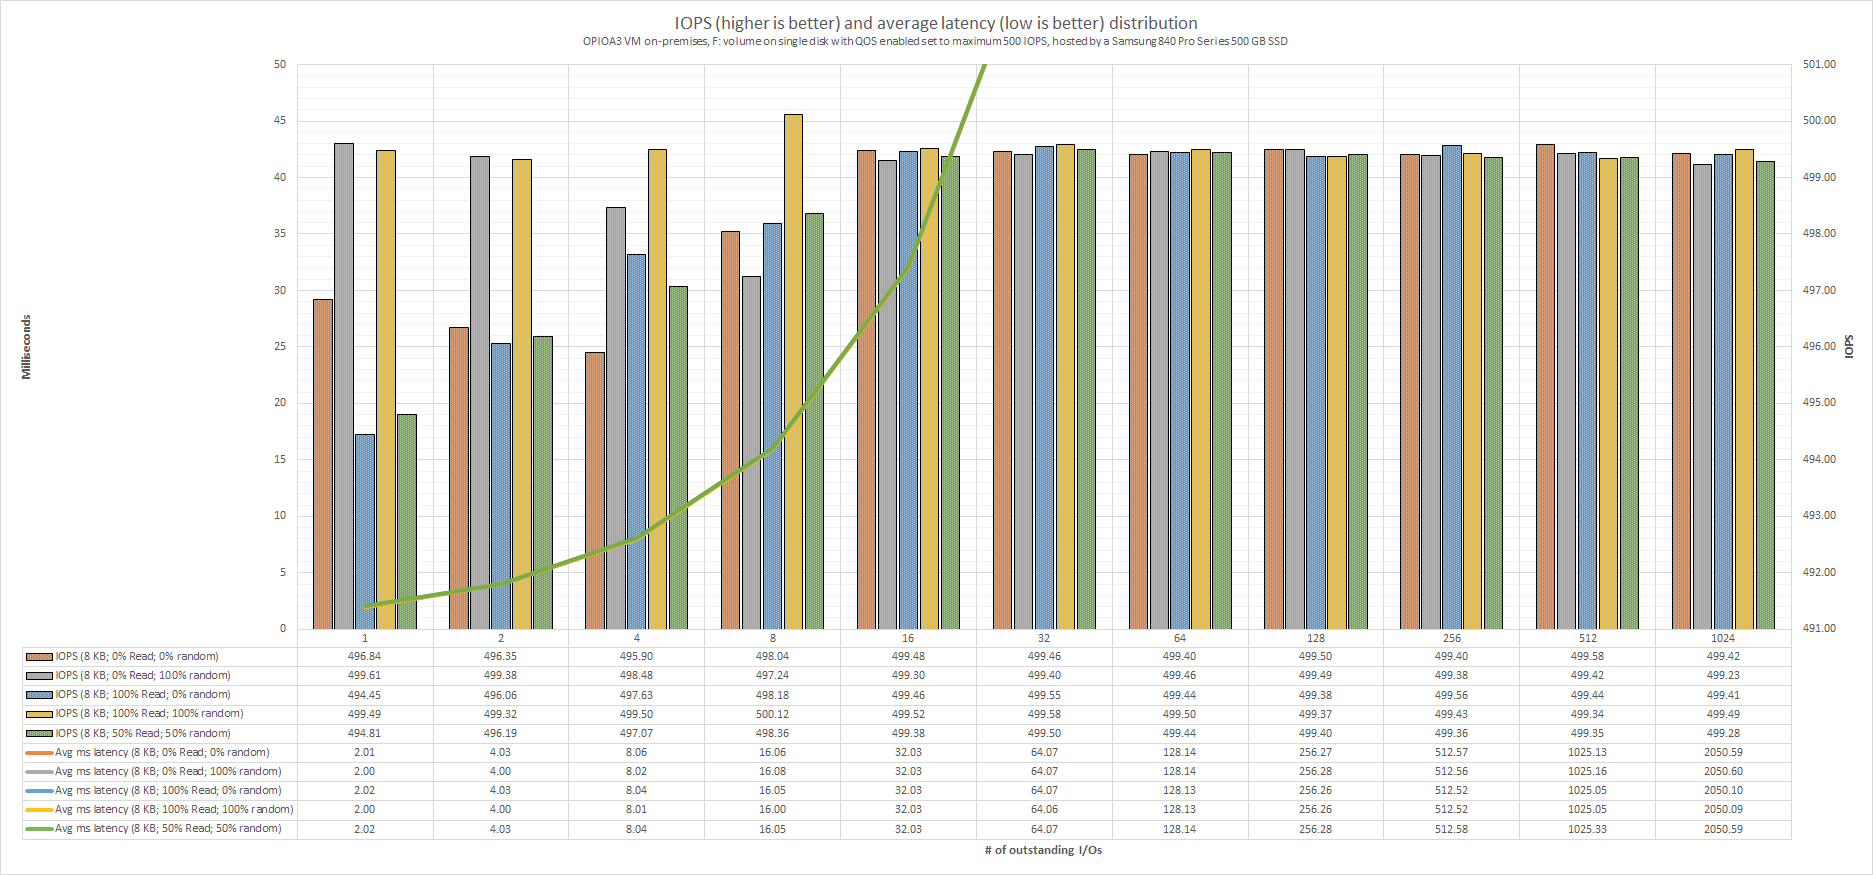
The above chart indicates the IOPS and average latency distribution across different workloads (# of Outstanding I/Os). If we take in consideration the 20 ms recommended latency, we can say whatever is higher than 8 outstanding I/Os (very light workloads) will result in application performance degradation. As can be seen the average latency is growing (up to 2.05 seconds) and gets way outside the chart limits.
Continue with Microsoft Azure IAAS – storage benchmarks, comparison with on-premises (part 9).