I will start the article with a short summary to make sure I am not losing the readers in technical data.
This article will proof that in most of the cases the poor performance in Microsoft Azure IaaS is caused by the storage performance. The poor, or unexpected low performance you will get with Microsoft Azure IaaS is not because Azure is not capable to support high IOPS or doesn’t has fast storage.
The problem is:
- first of all because Microsoft Azure Portal is providing virtual machine templates (aka virtual machine series) who look very tempting for the Azure users, but whom in fact fit only specific workloads.
- second of all the Azure users who don’t have a real understanding of their needs and jump into provisioning the VM series recommended by the Microsoft Azure portal.
The solution (especially when you don’t have the chance to fail, or when you don’t know the computing requirements of the resource you will host in Microsoft Azure): always start by provisioning DS-series or GS-series virtual machines hosted by Premium storage accounts. Of course this will come with much higher costs.
The conclusions are:
- Don’t negligee the storage! It is one of the most common bottlenecks. The CPU and RAM are handling processing with whom in terms of speed most of the time the storage cannot keep with.
- Consider Azure Premium Storage (P20 and P30) in your cost estimations because there is a limited set of applications who fit the workloads Standard Azure storage and Standard A, D, G VM series can handle.
- In the majority of the cases the storage is the most cost driven factor.
Now let’s go in technical details.
I performed storage benchmarks using Iometer and compared the results obtained on-premises with the ones obtained in Microsoft Azure. I organized the technical details in 9 parts:
- Describe what does the Iometer benchmarks will consist of.
- Terminology and understanding.
- Setup.
- Why did I used 8 KB benchmark tests?
- Why did I used MS Azure Standard Tier A series A3\large and DS3 VMs in the benchmarks?
- What will be the sequence and how the results will be processed?
- Describe how I configured the Azure VM and the benchmark results for the A3 Standard VM using a single disk hosted by Standard Locally Redundant Storage (LRS).
- Describe how I configured the Azure VM and the benchmark results for the A3 Standard VM using multiple (eight) disks in a RAID-0 (striped) configuration hosted by Standard Locally Redundant Storage.
- Describe how I configured the Azure VM and the benchmark results for the DS3 Standard VM using a single Premium P10 disk hosted by Premium Locally Redundant Storage (LRS).
- Describe how I configured the Azure VM and the benchmark results for the DS3 Standard VM using a single Premium P30 disk hosted by Premium Locally Redundant Storage (LRS).
- Describe how I configured the Azure VM and the benchmark results for the DS3 Standard VM using multiple (two) disks in a RAID-0 (striped) configuration hosted by Premium P30 Locally Redundant Storage.
- Describe how I configured the Azure VM and the benchmark results for the DS3 Standard VM using multiple (eight) disks in a RAID-0 (striped) configuration hosted by Standard Locally Redundant Storage.
- Describe how I configured the Hyper-V on-premises VM and the benchmark results using local HDD and SSD.
- IOPS benchmark detailed conclusions (on-premises and Azure IaaS).
Describe what does the Iometer benchmark will consist of
Terminology and understanding
When we discuss about storage benchmarks we will hear at least the following keywords: IOPS, Throughput, Latency, Number of Outstanding I/Os.
- IOPS – the amount read and/or write operations that could be processed in a second. In general the software companies are able to specify how exactly their software will consume the storage and are able to provide exact details in terms of what kind of IOPS will be generated.
IOPS are defined by:- size: 4 Kbytes, 8 Kbytes, 64 Kbytes, 128 Kbytes …
- kind of operation:
- percentage of random / sequential distribution;
- percentage of read / write distribution;
- Throughput – is expressed in Megabytes per second and represents the amount of data processed in a second (directly proportional with the number of I/O operations performed in a second).
- Latency – is the time taken for a single I/O request to be handled. As in the case of the IOPS, in general the software companies are able to specify how exactly their software will consume the storage and are able to provide exact details in terms of what kind of latency should be considered in order the software solution to run in optimal parameters.
The 20 ms (20 milliseconds) latency is considered (link1, link2, link3, link4) as being the point where the storage performance starts to slow down the applications. So, in case you don’t know the exact latency specifications, consider the >20 ms latency as being “not fast enough”. - Number of Outstanding I/Os allows to gradually reach the storage speed limits. When this number is increased the OS will queue up multiple requests and will saturate (from speed / performance point of view) the storage -> in this way we will find out the maximum number of IOPS the storage can handle.
In general:- 1 outstanding I/O – linear
- 4 outstanding I/Os – very light
- 16 outstanding I/Os – light
- 64 outstanding I/Os – moderate
- 256 outstanding I/Os – heavy
Setup
Iometer is the unquestionable IOPS benchmark tool. Even if the project wasn’t continued and the last updates are years ago, this tool reached the maturity in terms of functionality.
I configured the benchmark disk worker to run:
- on a benchmark file in size of 5 GB (10485760 sectors – for Iometer one sector is 512 Bytes);
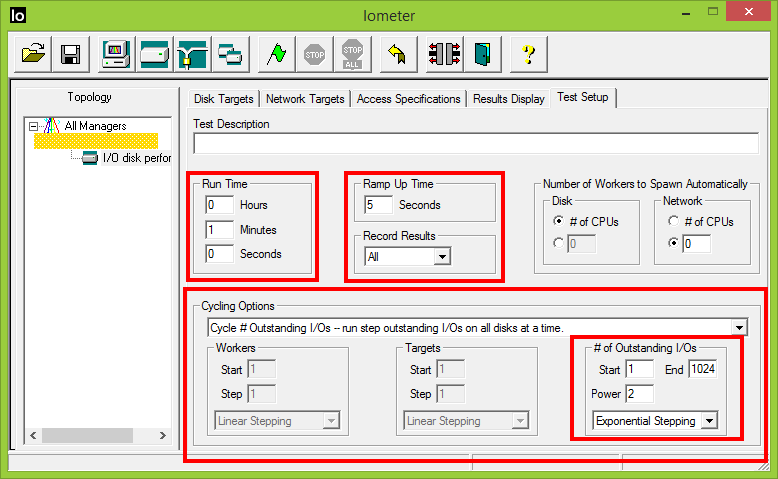
- with 5 seconds ramp up between the tests;
- with 1 minute run time per test;
- with number of outstanding I/Os configured to grow exponentially (1, 2, 4, 8, 16, 32, 64, 128, 256, 512, 1024);
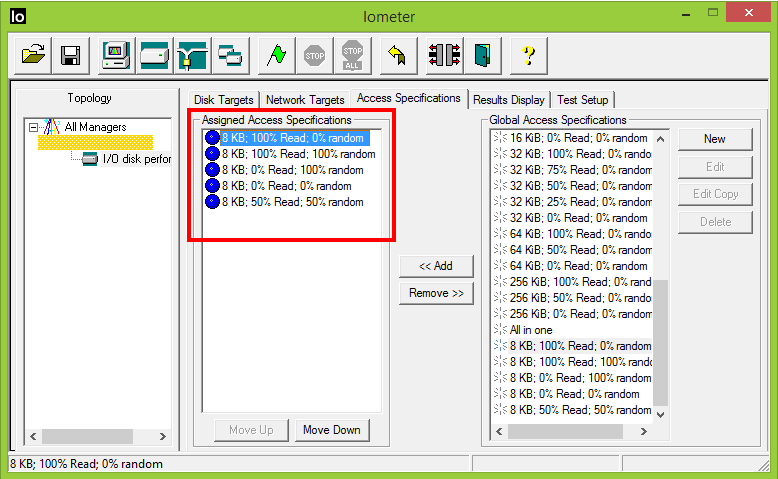
- with five access specifications:
- 8 KB; 100% Read; 0% random (8 KB transfer request size, 100% read distribution, 100% sequential distribution)
- 8 KB; 100% Read; 100% random (8 KB transfer request size, 100% read distribution, 100% random distribution)
- 8 KB; 0% Read; 100% random (8 KB transfer request size, 100% write distribution, 100% random distribution)
- 8 KB; 0% Read; 0% random (8 KB transfer request size, 100% write distribution, 100% sequential distribution)
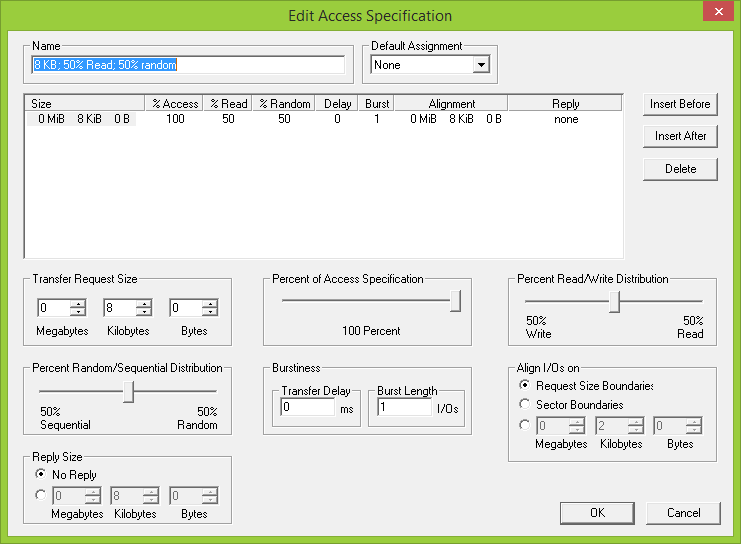
- 8 KB; 50% Read; 50% random (8 KB transfer request size, 50% read and 50% write distribution, 50% sequential and 50% random distribution)
- These above mentioned access specifications are representing the extreme application usage behavior. In general the number of read operations is a bit higher than the writes and the percentage of random I/O varies (is not all the time 100% random). The idea is to benchmark the extremes.
The benchmark configuration file can be downloaded from here.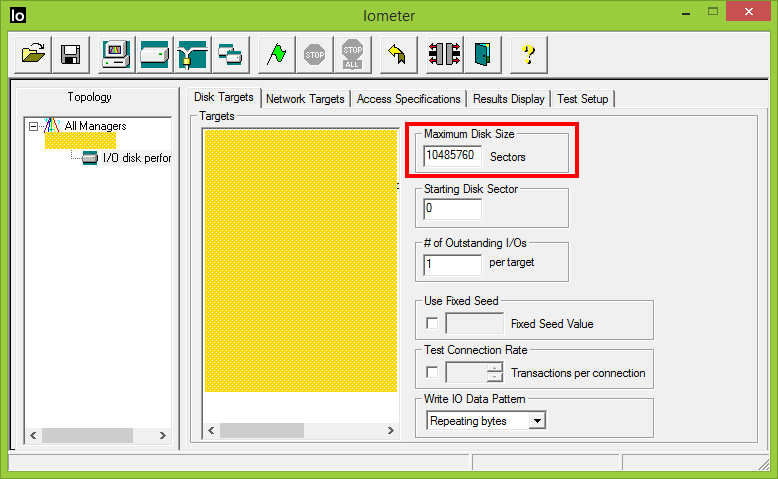
Why did I used 8 KB stress tests?
- because 8 KB is the MS SQL page size (the fundamental unit of data storage in SQL Server);
- because the Storage Quality of Service for Hyper-V has IOPS measured in 8 KB increments (and the Azure Virtual Machines are running on Hyper-V);
- it is the most common size across Microsoft products and services;
- it is very close to 4 KB – which is another common value found in the IOPS debates;
- the IOPS are not the same across all systems, but in all the benchmark tests I performed I used only this value (8 KB) just to make sure I compare multiple sets of results obtained using the same benchmark parameters;
Why did I used a MS Azure Standard Tier A series A3\large and DS3 VMs in the benchmark tests?
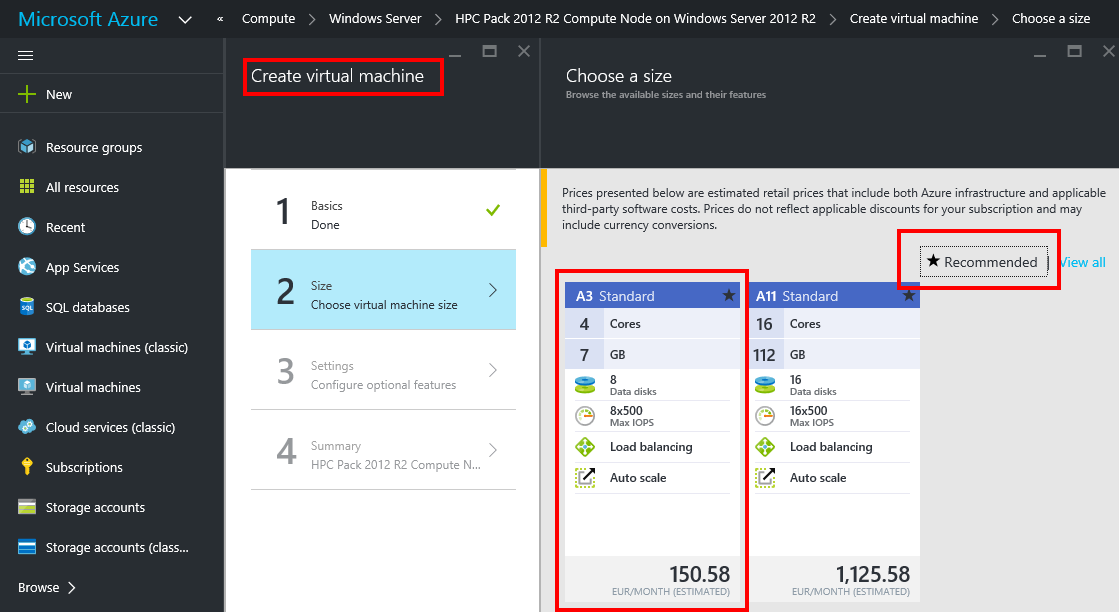
- because Azure A3 Standard is the recommended VM by the Microsoft Azure Portal;
- because from configuration point of view (CPU, memory RAM and OS), the VMs I will use for the storage benchmarks on-premises and Azure will be close as possible:
- CPU Cores: 4
- Memory: 7 GB / 14 GB
- OS: Windows Server 2012 R2 Datacenter Edition
- because the Azure DS3 has the closest configuration with Azure A3 Standard (4 cores, maximum 8 additional disks), but DS3 allows us to benchmark the Azure Premium storage (and the tests will also show if there is a difference between A3 and DS3 using Standard Locally Redundant Storage).
What will be the sequence and how the results will be processed?
- Each Azure Virtual Machine will be hosted by two Azure storage accounts:
- one storage account will be used to host the virtual disk used by the Operating System;
- the other storage account will host the additional virtual disks mounted to the Azure VM (F:\ volume) who will be used for benchmarks;
In this way the benchmark tests are not influenced by other workloads (e.g. the F:\ volume benchmark results will not be affected by the IOPS generated by the Operating System).
We will use Azure Standard and Premium storage for the benchmark tests.
- The on-premises virtual machine will have an identical configuration with the VMs used in Azure.
The disk layout will be identical:- The operating system virtual disk and the temporary storage will be hosted by separated physical disks (the D:\ volume will be hosted by SSD);
- The additional virtual disk mounted to the on-premises VM (F:\ volume) will be used for benchmarks and will be hosted:
- by a Western Digital Scorpio Black WD5000BEKT 500GB HDD (the consumer on-premises “equivalent” of Azure Standard storage);
- by a Samsung 840 Pro Series 500 GB SSD (the consumer on-premises “equivalent” of Azure Premium storage);
- The results will be collected and analyzed (IOPS, throughput, latency and number of outstanding I/Os);
- At the end we will take conclusions based on the on-premises and Azure results;
Continue with Microsoft Azure IAAS – storage benchmarks, comparison with on-premises (part 2).