This article is part of a series of 9 where I am talking about storage benchmarks performed on Microsoft Azure and on-premises. For a better understanding please make sure you read also the other parts:
- Describe what does the Iometer benchmarks will consist of.
- Describe how I configured the Azure VM and the benchmark results for the A3 Standard VM using a single disk hosted by Standard Locally Redundant Storage (LRS).
- Describe how I configured the Azure VM and the benchmark results for the A3 Standard VM using multiple (eight) disks in a RAID-0 (striped) configuration hosted by Standard Locally Redundant Storage.
- Describe how I configured the Azure VM and the benchmark results for the DS3 Standard VM using a single Premium P10 disk hosted by Premium Locally Redundant Storage (LRS).
- Describe how I configured the Azure VM and the benchmark results for the DS3 Standard VM using a single Premium P30 disk hosted by Premium Locally Redundant Storage (LRS).
- Describe how I configured the Azure VM and the benchmark results for the DS3 Standard VM using multiple (two) disks in a RAID-0 (striped) configuration hosted by Premium P30 Locally Redundant Storage.
- Describe how I configured the Azure VM and the benchmark results for the DS3 Standard VM using multiple (eight) disks in a RAID-0 (striped) configuration hosted by Standard Locally Redundant Storage.
- Describe how I configured the Hyper-V on-premises VM and the benchmark results using local HDD and SSD.
- IOPS benchmark detailed conclusions (on-premises and Azure IaaS).
A3 Standard VM using multiple (eight) disks (in RAID-0 striped configuration) hosted by Standard Locally Redundant Storage – setup and benchmark results
An important aspect of Azure is that the IOPS and the throughput are limited by the VM series and size. The MS Azure Standard Tier A series A3\large VM is limited to maximum 8 disks with maximum 500 IOPS per disk. So, in theory a RAID 0 from 8 disks with 500 IOPS each could result in 4000 IOPS. Another very important aspect is the standard storage accounts are limited at 20,000 IOPS. Standard Locally Redundant Storage is the cheapest Azure storage account type. For this type of VM and storage, the default setting of the virtual disk host caching is set to None.
The following PowerShell commands have been used to provision an A3 Standard VM with multiple (eight) disks hosted by Locally Redundant Storage (benchmark setup).
Add-AzureAccount
$subscriptionName = '<YOUR SUBSCRIPTION NAME>'
$VMOSStorageAccountName = 'aziowosdisks'
$IOStressStorageAccountName = 'aziostressdisks'
$location = 'West Europe'
$adminName = '<YOUR ADMIN USER NAME>'
$adminPassword = '<YOUR PASSWORD>'
$vmName ='AZIOA3'
$imageFamily = 'Windows Server 2012 R2 Datacenter'
$vmSize ='Large'

Select-AzureSubscription -SubscriptionName $subscriptionName -Current

New-AzureStorageAccount -StorageAccountName $VMOSStorageAccountName -Location $location -Type 'Standard_LRS'
New-AzureStorageAccount -StorageAccountName $IOStressStorageAccountName -Location $location -Type 'Standard_LRS'

$imageName = Get-AzureVMImage | where { $_.ImageFamily -eq $imageFamily } | sort PublishedDate -Descending | select -ExpandProperty ImageName -First 1
Set-AzureSubscription -SubscriptionName $subscriptionName -CurrentStorageAccount $VMOSStorageAccountName
$OSDiskPath = "https://" + $VMOSStorageAccountName + ".blob.core.windows.net/vhds/" + $vmName + "_OS.vhd"
$vm = New-AzureVMConfig -Name $vmName -ImageName $imageName -InstanceSize $vmSize -MediaLocation $OSDiskPath
Add-AzureProvisioningConfig -Windows -VM $vm -AdminUsername $adminName -Password $adminPassword
New-AzureVM -ServiceName $vmName -VMs $VM -Location $location

Set-AzureSubscription -SubscriptionName $subscriptionName -CurrentStorageAccount $IOStressStorageAccountName

#These will attach eight new data disks configured to use the default host caching (None) on Standard_LRS
Get-AzureVM $vmName -Name $vmName | Add-AzureDataDisk -CreateNew -DiskSizeInGB 127 -DiskLabel "DATA01" -LUN 0 | Update-AzureVM
Get-AzureVM $vmName -Name $vmName | Add-AzureDataDisk -CreateNew -DiskSizeInGB 127 -DiskLabel "DATA02" -LUN 1 | Update-AzureVM
Get-AzureVM $vmName -Name $vmName | Add-AzureDataDisk -CreateNew -DiskSizeInGB 127 -DiskLabel "DATA03" -LUN 2 | Update-AzureVM
Get-AzureVM $vmName -Name $vmName | Add-AzureDataDisk -CreateNew -DiskSizeInGB 127 -DiskLabel "DATA04" -LUN 3 | Update-AzureVM
Get-AzureVM $vmName -Name $vmName | Add-AzureDataDisk -CreateNew -DiskSizeInGB 127 -DiskLabel "DATA05" -LUN 4 | Update-AzureVM
Get-AzureVM $vmName -Name $vmName | Add-AzureDataDisk -CreateNew -DiskSizeInGB 127 -DiskLabel "DATA06" -LUN 5 | Update-AzureVM
Get-AzureVM $vmName -Name $vmName | Add-AzureDataDisk -CreateNew -DiskSizeInGB 127 -DiskLabel "DATA07" -LUN 6 | Update-AzureVM
Get-AzureVM $vmName -Name $vmName | Add-AzureDataDisk -CreateNew -DiskSizeInGB 127 -DiskLabel "DATA08" -LUN 7 | Update-AzureVM
The above PowerShell commands created two Standard Locally Redundant Storage accounts:
- aziowosdisks – used to host the OS disk of the VM.
- aziostressdisks – used to host the additional disk mapped to the VM.
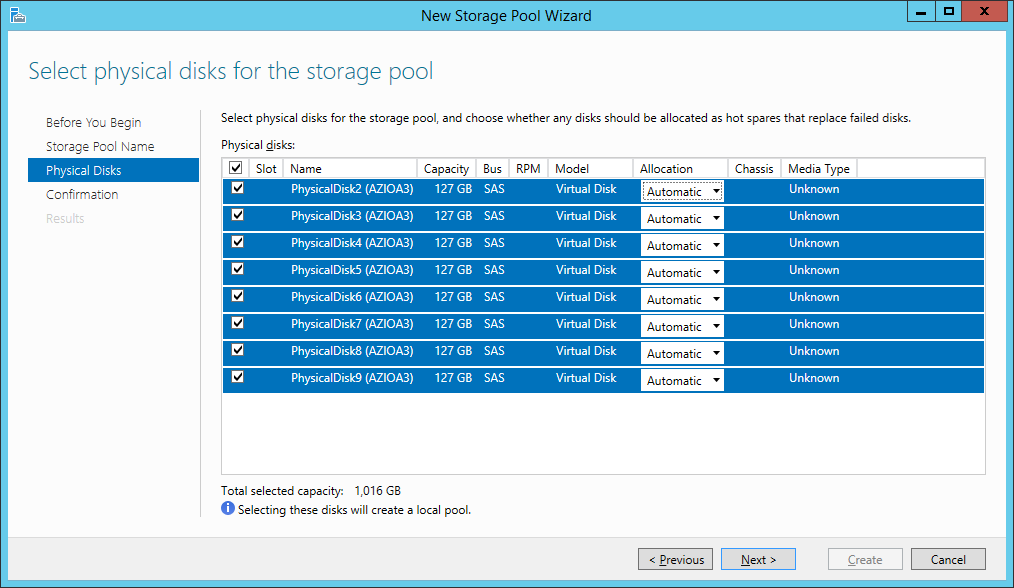
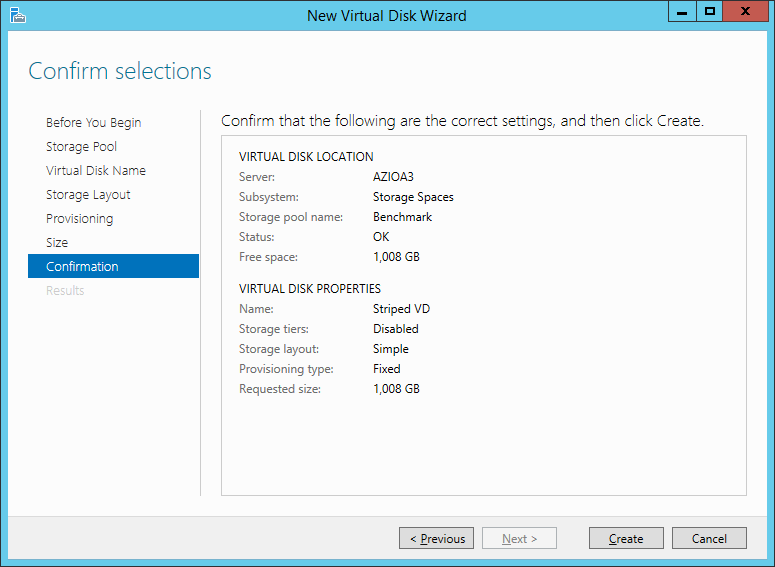
The IOPS benchmarks are performed on the additional eight mapped disks (F volume will be a stripe of 8 x 127 GB disks). The aziostressdisks storage account will only host the eight additional virtual disks (F:\ volume) – so in this way the benchmark tests are not influenced by other workloads.
Benchmark results (A3 Standard VM, F: volume on eight striped disks, hosted by Azure Standard Locally Redundant Storage)
The Iometer results can be downloaded from here.
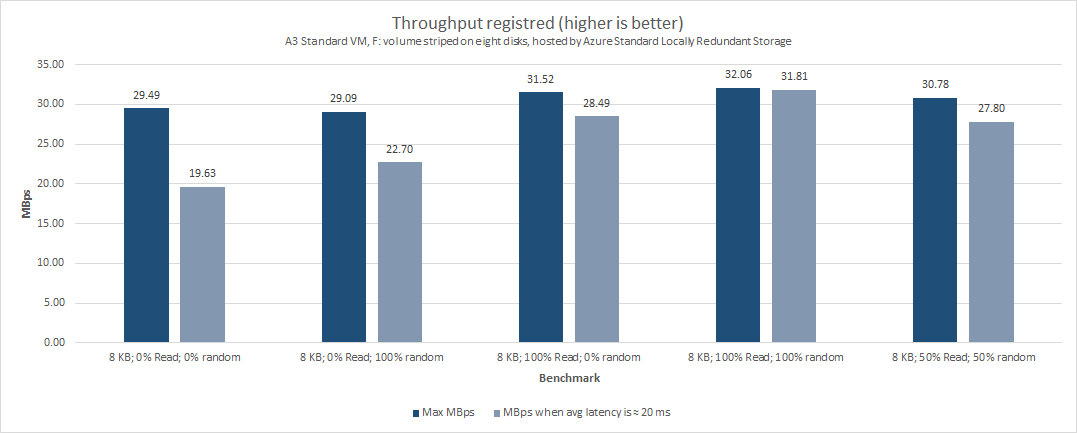
In the above chart you can see the registered throughput. Very important to be noticed is the fact this time we register eight times the speed (≈32 MBps) we registered with a single disk (≈4 MBps). As expected the RAID-0 made of eight disks indeed improves the storage performance (32.06 MBps at 32.65 ms average latency). If we take in consideration the 20 ms recommended latency, we can see the throughput is not that close to the maximum registered value – which indicates clearly the limits are mainly caused by the physical storage (and not by the QOS limits applied by Azure).
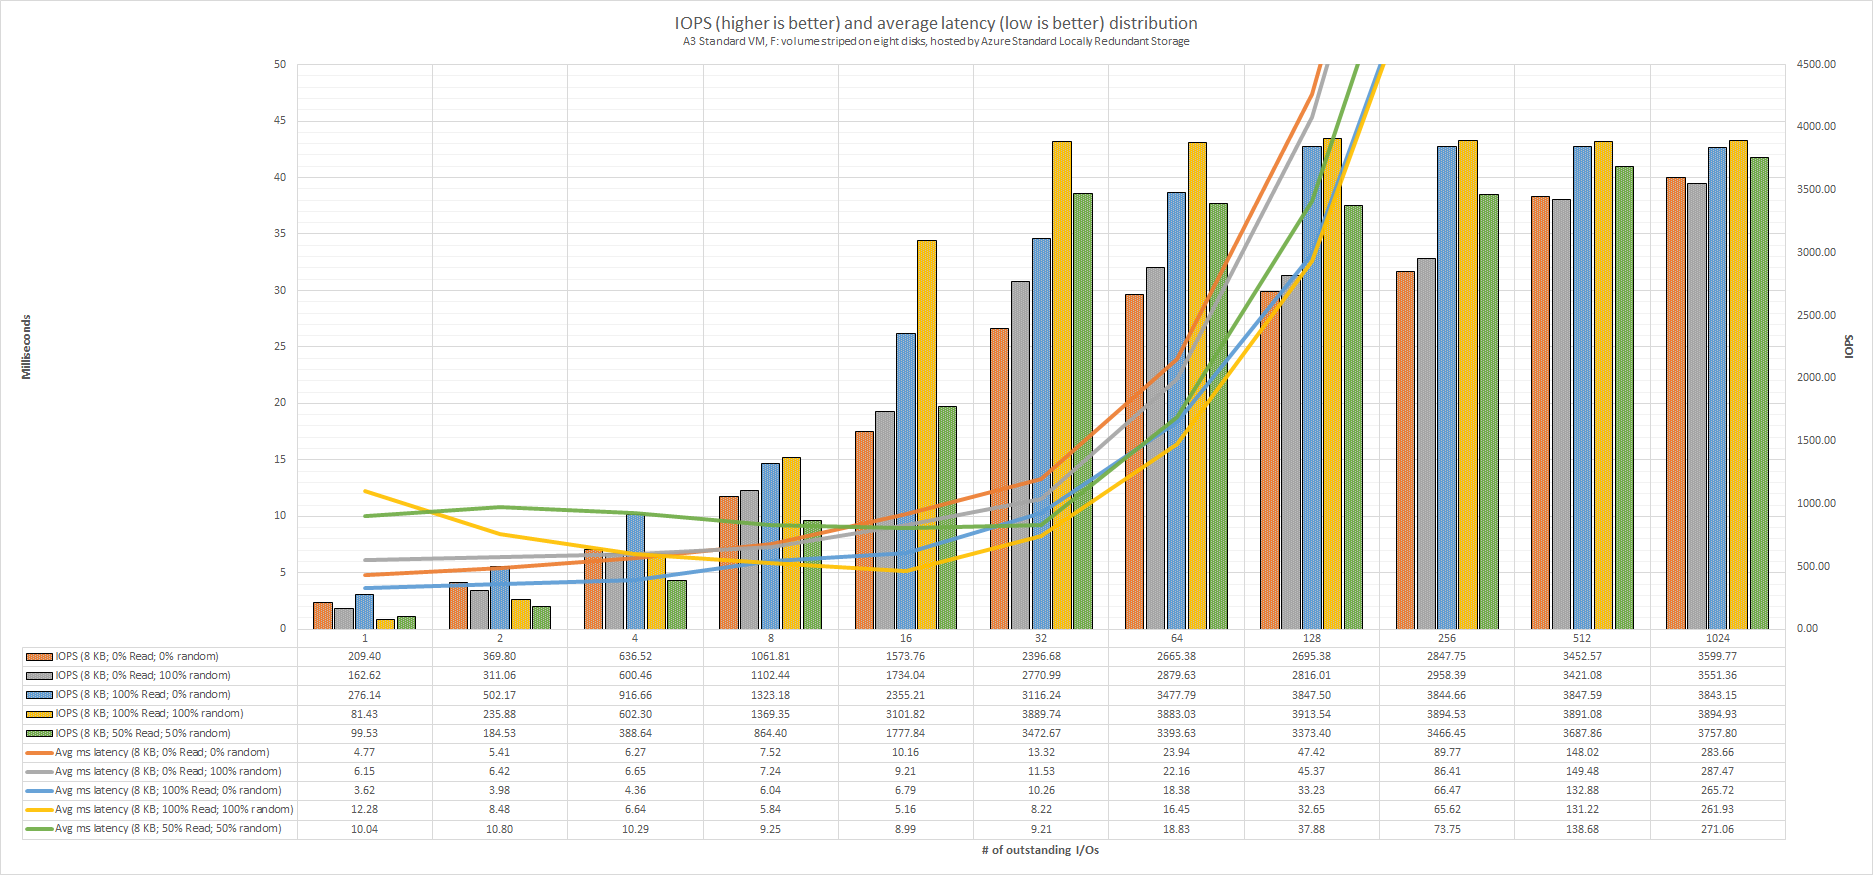
The above chart indicates the IOPS and average latency distribution across different workloads (# of Outstanding I/Os). If we take in consideration the 20 ms recommended latency, we can say whatever is higher than 64 outstanding I/Os (moderate workloads) will result in application performance degradation. As can be seen the average latency is growing (up to 287.47 ms) and gets outside the chart limits.
What I find unexpected to these results is the fact the “8 KB; 100% Read; 100% random” and “8 KB; 50% Read; 50% random” benchmarks are actually providing better performance results at 16 Outstanding I/Os rather than 1 Outstanding I/O.
Combined with the results from the previous chart we can conclude an application who is using this type of storage setup will provide optimal performance if:
- does have a moderate storage load (up to 64 outstanding I/Os);
- the expected throughput is between ≈19 and ≈31 MBps;
For this storage setup (volume striped on eight disks hosted by Azure Standard LRS):
- I recommend it for hosting:
- web servers (site files) for systems with moderate to high usage;
- MS SQL servers (database data and transaction log files) only for systems with light to moderate storage usage;
- file shares with light to moderate usage;
- test & development VMs and production VMs with moderate usage;
- I definitely not recommend it for hosting:
- VMs with heavy storage usage;
- VMs with applications who rely on fast storage;
Continue with Microsoft Azure IAAS – storage benchmarks, comparison with on-premises (part 4).