This article is part of a series of 5 where I am talking about the Microsoft Azure network bandwidth. For a better understanding please make sure you read also the other parts:
- What does Microsoft mean by low / moderate / high / very high / extremely high Azure network bandwidth (part 1)
- The isolated network setup (the environment used for network analysis) (part 2)
- What happens when we perform a PING? (part 2.1)
- What happens when we perform a PING in size of 4086 bytes? (part 2.2)
- Now let’s see what exactly happens when a file is copied over the network (file share) (part 2.3)
- Now let’s see what exactly happens when MS SQL traffic is performed (part 2.4)
- Now let’s see what exactly happens when IIS HTTP/HTTPS traffic is performed (part 2.5)
- The IOmeter benchmark tests who reproduce as close as possible the HTTP/HTTPS, SMB and MS SQL network traffic (part 3)
- The Azure Virtual Machines used to run the IOmeter benchmarks (part 4)
- Results and interpretations
- 4096 B; 0% Read; 0% random (part 5.1)
- 62780 B; 0% Read; 0% random (part 5.2)
- 1460 B; 100% Read; 0% random (part 5.3)
Results for the 1460 B; 100% Read; 0% random (1460 Bytes transfer request size, 100% read distribution, 0% random distribution) benchmark
Frame size for a single network I/O operation => 14 bytes (ETH) + 20 bytes (IP) + 20 bytes (TCP) + 1460 bytes (TCP data) = 1514 bytes (3.57% protocol overhead and 96.43% data)
Packet size for a single network I/O operation => 20 bytes (IP) + 20 bytes (TCP) + 1460 bytes (TCP data) = 1500 bytes
Low vs Moderate vs High
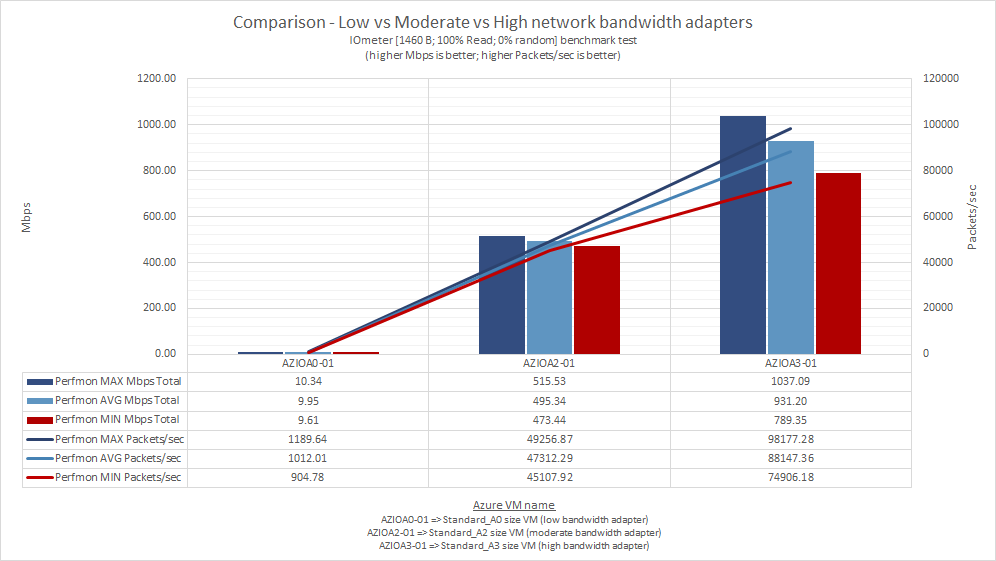
From the [1460 B; 100% Read; 0% random] IOmeter benchmark results, we can say:
- Azure Low bandwidth performance is around ≈10 Mbps total (send & receive);
- Azure Moderate bandwidth performance is around ≈500 Mbps total (send & receive);
- Azure High bandwidth performance is around ≈1 Gbps total (send & receive);
Please note the numbers based on which this chart has been generated have been collected using Performance Monitor.
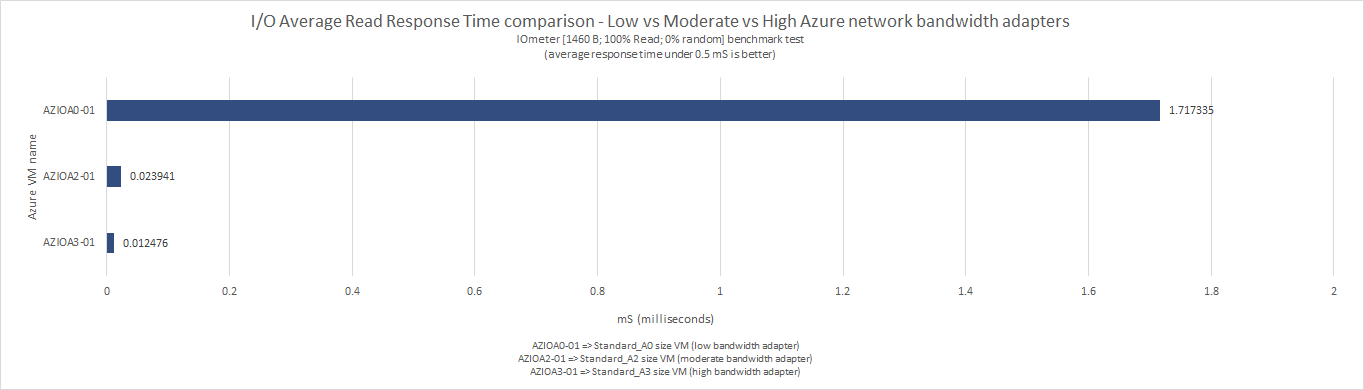
This time the chart indicates the average read response time IOmeter recorded for the [1460 B; 100% Read; 0% random] I/Os. As the chart indicates, when the network is saturated the average read response time is higher than 0.5 mS for the Azure Low bandwidth. As observed in the previous tests, the only way to reduce the average response time for Azure Low is by reducing the network packet data size. The consequence will be – a lower data transfer capacity, but with good latency response times. After seeing all the benchmark results we can clearly say this type of network is adequate for DNS, DHCP, LDAP and in general all the protocols who are not data intensive network operations.
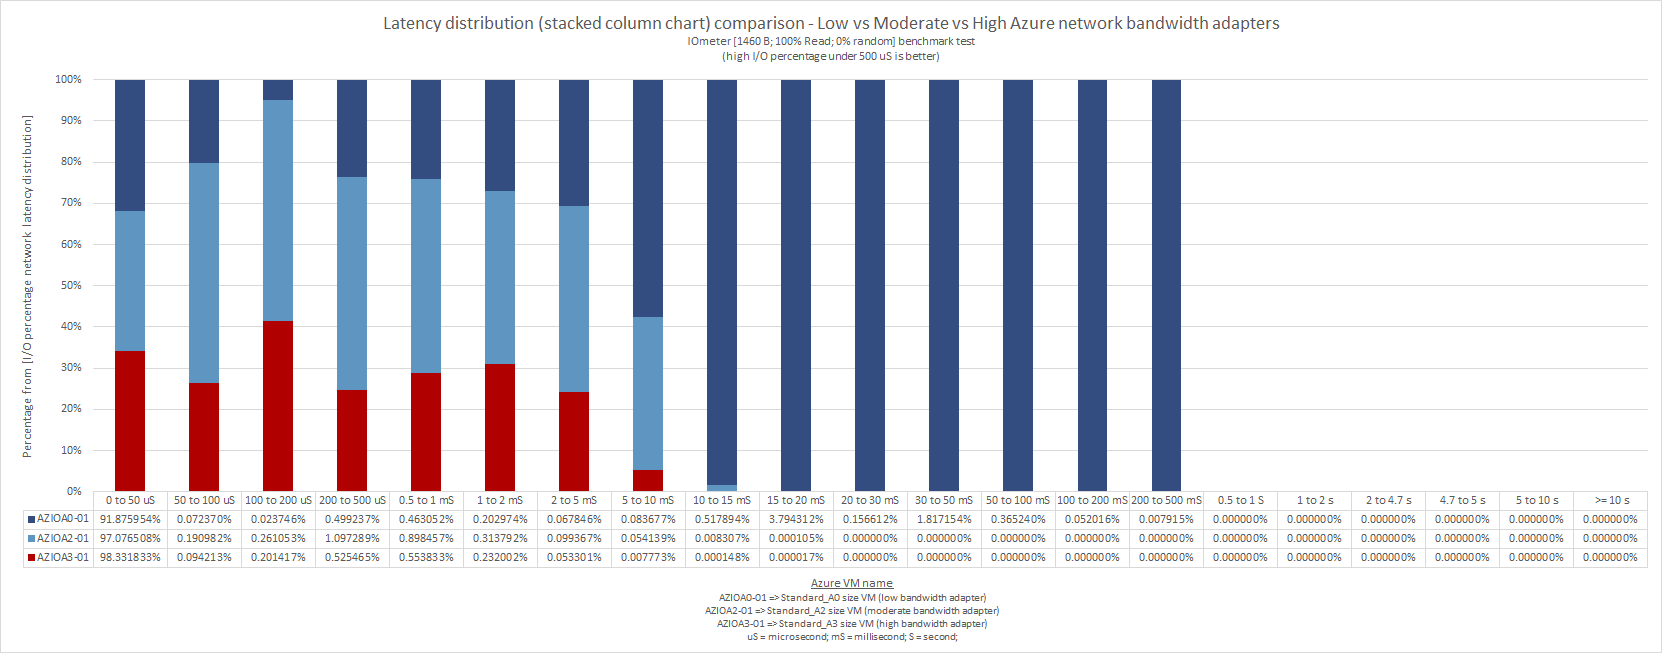
The above stacked column chart represents the latency distribution for the [1460 B; 100% Read; 0% random] IOmeter benchmark. The best performer is Azure High network bandwidth (AZIOA3-01), followed by Azure Moderate (AZIOA2-01) and Azure Low (AZIOA0-01) network bandwidth.
Please note the time axis is not linear (it is a logarithmic one), case in which the jump from one interval to the other is considerable high. If we pay attention to the Azure Low network bandwidth we can see a very high percentage (91.875954%) of its I/Os being completed within 0 and 50 uS (microseconds), but it also records some percentages outside the 0.5 mS limit. Even if those percentages are small, the fact are recorded for intervals like 15 to 20 mS or 30 to 50 mS are making the Azure Low network bandwidth not a good performer (in comparison with Azure Moderate and High).
High vs Very High vs Extremely High
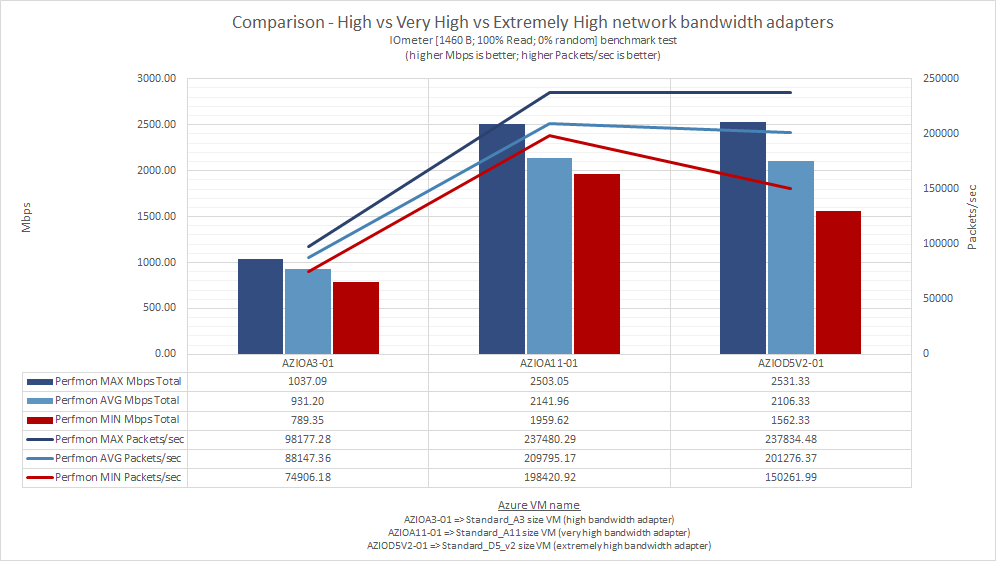
As we got used with this till now, we can see there is a clear difference in performance between Azure High and Azure Very High or Extremely High network bandwidth adapters:
- Azure High bandwidth performance is around ≈1 Gbps total (send & receive);
- Azure Very High bandwidth performance is around ≈2.5 Gbps total (send & receive);
- Azure Extremely High bandwidth performance is around ≈2.5 Gbps total (send & receive);
Looking at the average speeds registered by Azure Very High and Azure Extremely High network bandwidths, I tend to say again – there is not that much difference between them in terms of performance. Please note the numbers based on which this chart has been generated have been collected using Performance Monitor.
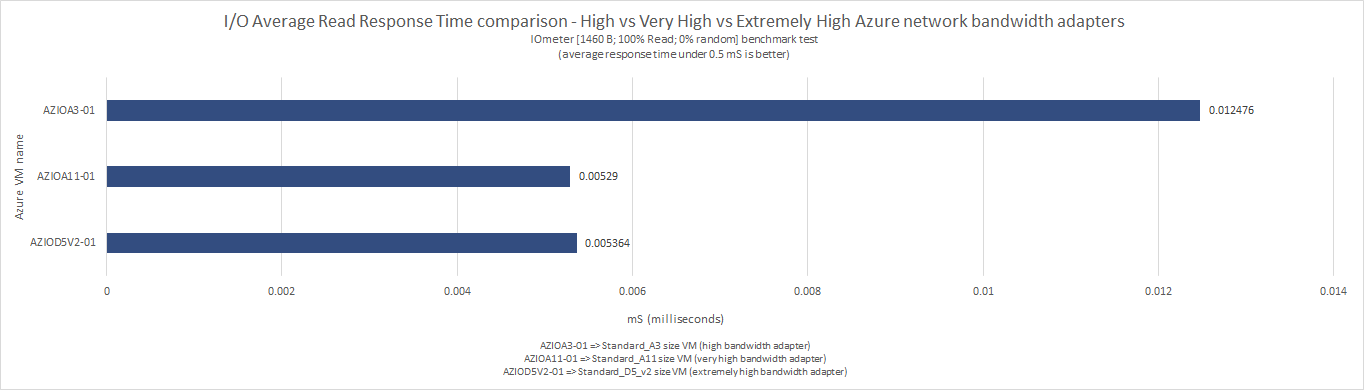
In terms of read response time, all these VMs registered in average under 0.5 mS. That means the Azure High, Very High or Extremely High network bandwidths can handle very well the network traffic even when the network is saturated with this type of traffic ([1460 B; 100% Read; 0% random]).
As noticed also in the previous chart, there is a clear difference in performance between Azure High and Azure Very High or Extremely High, but the last two are not much different one from the other.
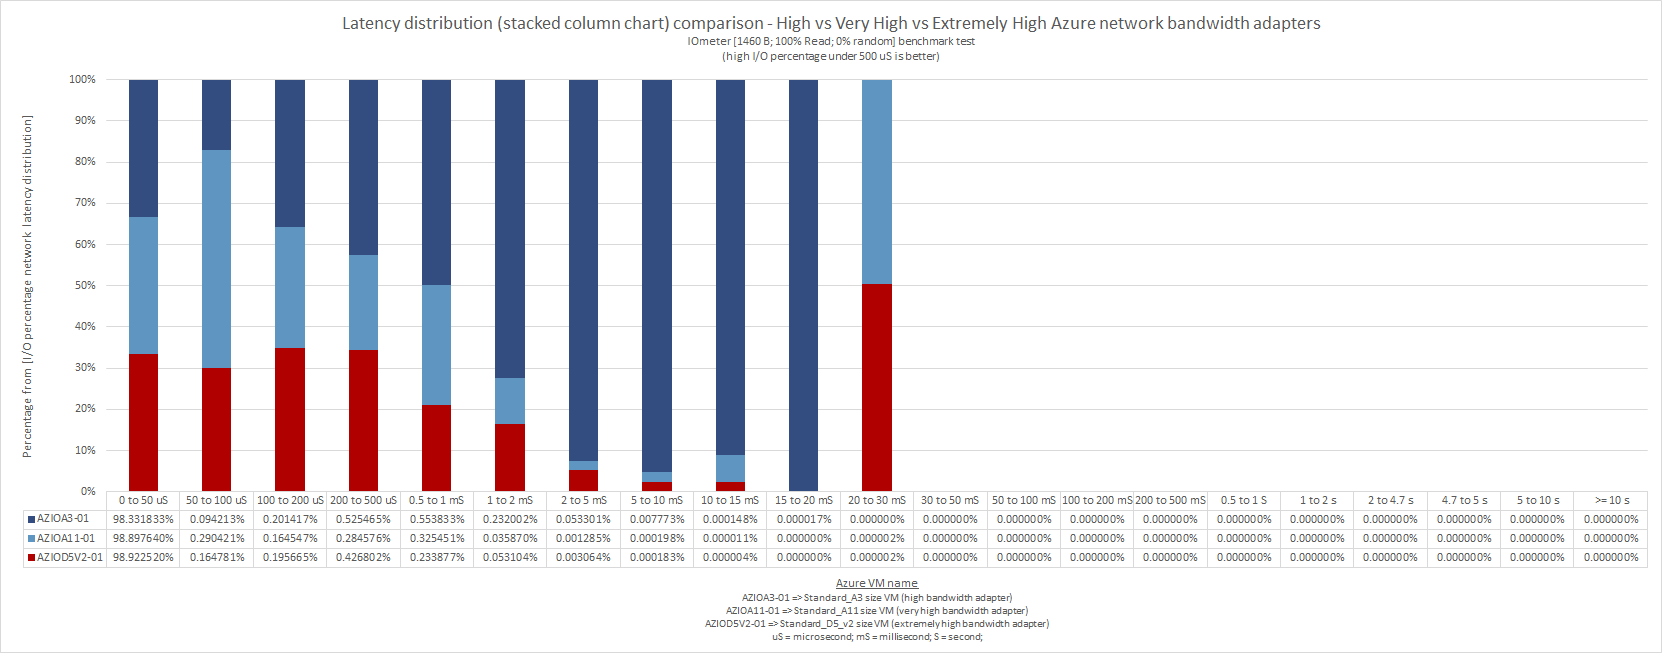
If we look on the latency distribution chart, for this type of benchmark it is very hard to decide who is the first and who is the second in terms of performance (the third is clearly AZIOA3-01 – Azure High network bandwidth).
I tend to say, the “battle” between them is given by the decimals and becomes a mathematical one. I think in reality the performance differences are too small to be observed. So no matter if we discuss Azure High, Very High or Extremely High network bandwidth – for this benchmark, all of them indicated good results from latency point of view.