This article is part of a series of 5 where I am talking about the Microsoft Azure network bandwidth. For a better understanding please make sure you read also the other parts:
- What does Microsoft mean by low / moderate / high / very high / extremely high Azure network bandwidth (part 1)
- The isolated network setup (the environment used for network analysis) (part 2)
- What happens when we perform a PING? (part 2.1)
- What happens when we perform a PING in size of 4086 bytes? (part 2.2)
- Now let’s see what exactly happens when a file is copied over the network (file share) (part 2.3)
- Now let’s see what exactly happens when MS SQL traffic is performed (part 2.4)
- Now let’s see what exactly happens when IIS HTTP/HTTPS traffic is performed (part 2.5)
- The IOmeter benchmark tests who reproduce as close as possible the HTTP/HTTPS, SMB and MS SQL network traffic (part 3)
- The Azure Virtual Machines used to run the IOmeter benchmarks (part 4)
- Results and interpretations
Based on so far network analysis I defined three IOmeter benchmark tests that reproduce as close as possible the HTTP/HTTPS, SMB and MS SQL network traffic:
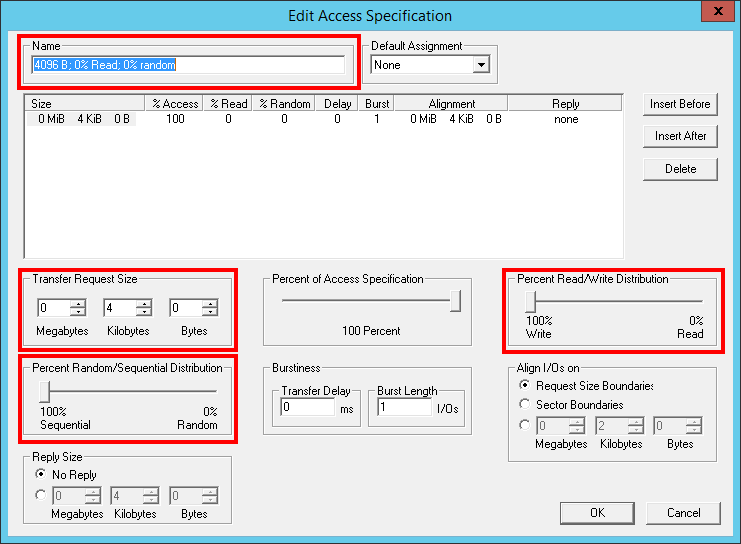
- 4096 B; 0% Read; 0% random (4096 Bytes transfer request size, 100% write distribution, 0% random distribution)
- 62780 B; 0% Read; 0% random (62780 Bytes transfer request size, 100% write distribution, 0% random distribution)
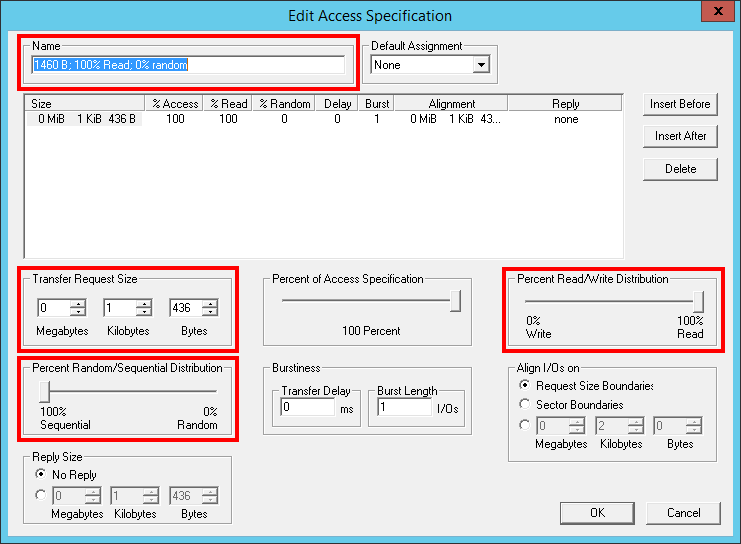
- 1460 B; 100% Read; 0% random (1460 Bytes transfer request size, 100% read distribution, 0% random distribution)
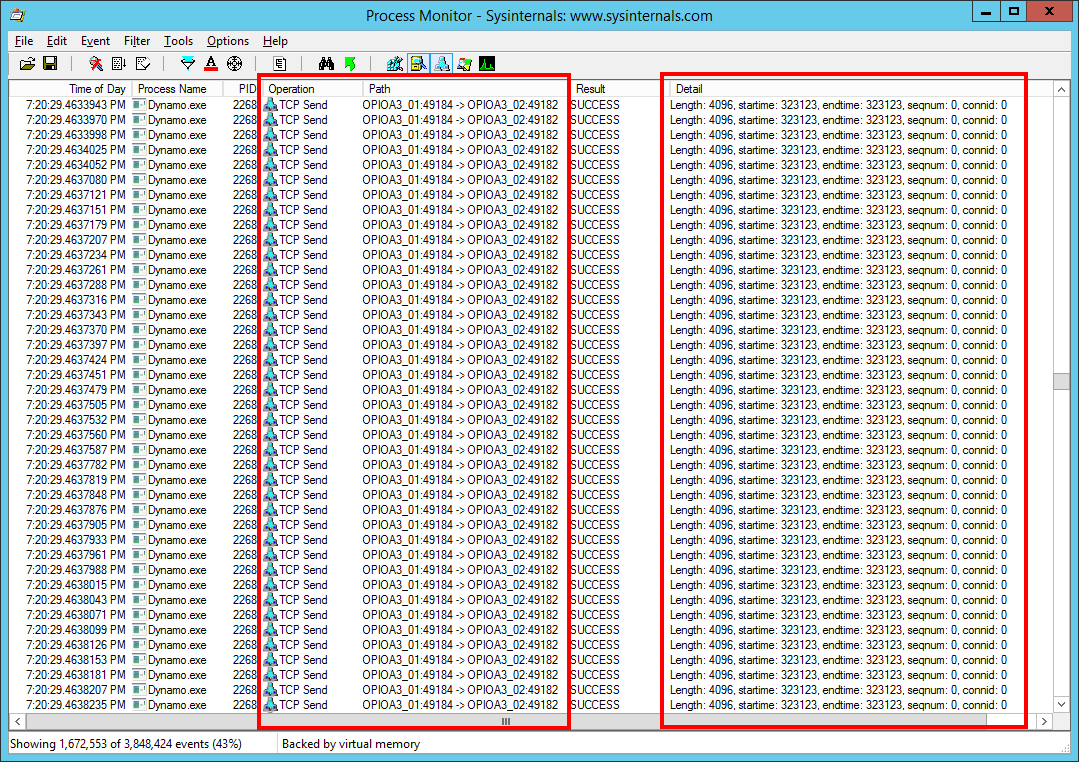
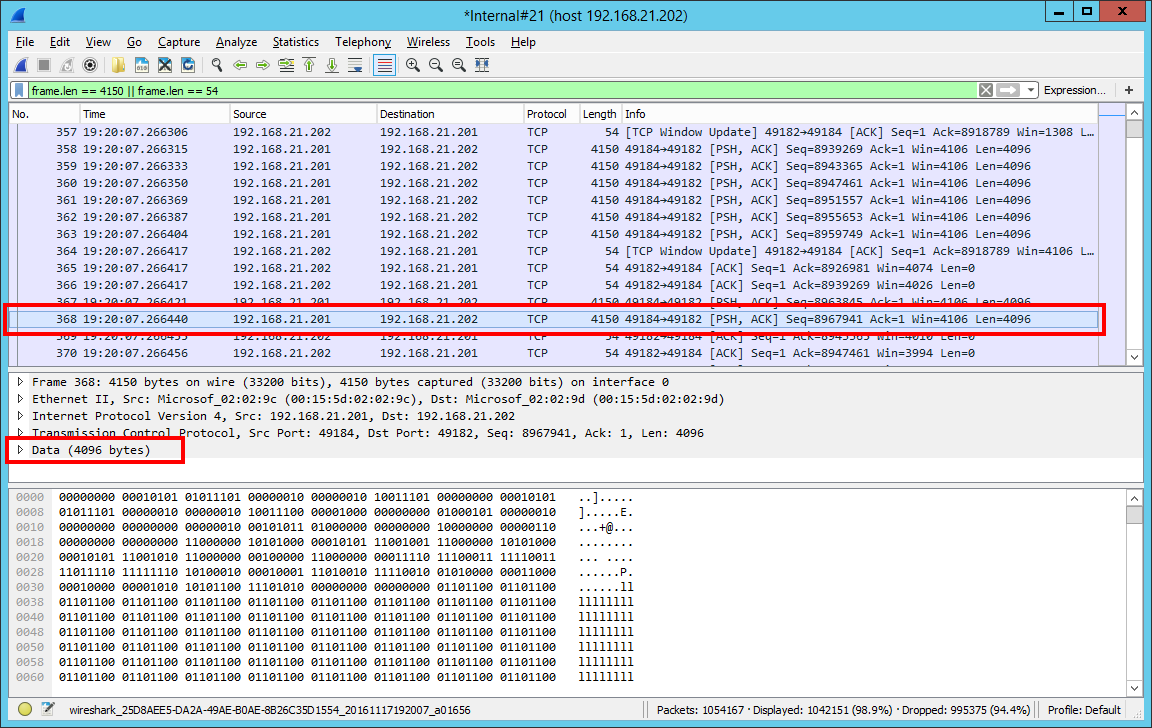
4096 B; 0% Read; 0% random (4096 Bytes transfer request size, 100% write distribution, 0% random distribution)
The IOmeter [4096 B; 0% Read; 0% random] benchmark test purpose is to help us reproduce the MS SQL traffic. As we saw in the MS SQL network analysis, by default the MS SQL instances are actually working at the network level with packets up to 4096 bytes. This test allows us to some extend reproduce / simulate an “MS SQL” instance on steroids who is always sending data over the network (and always running at the maximum).
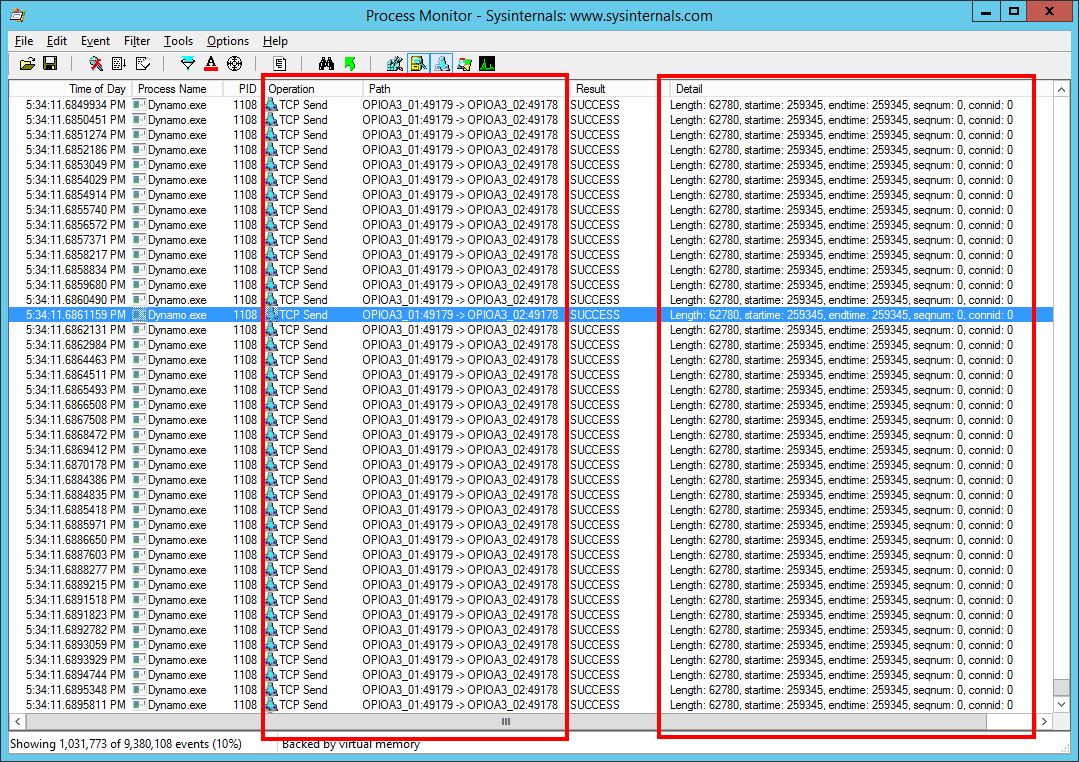
62780 B; 0% Read; 0% random (62780 Bytes transfer request size, 100% write distribution, 0% random distribution)
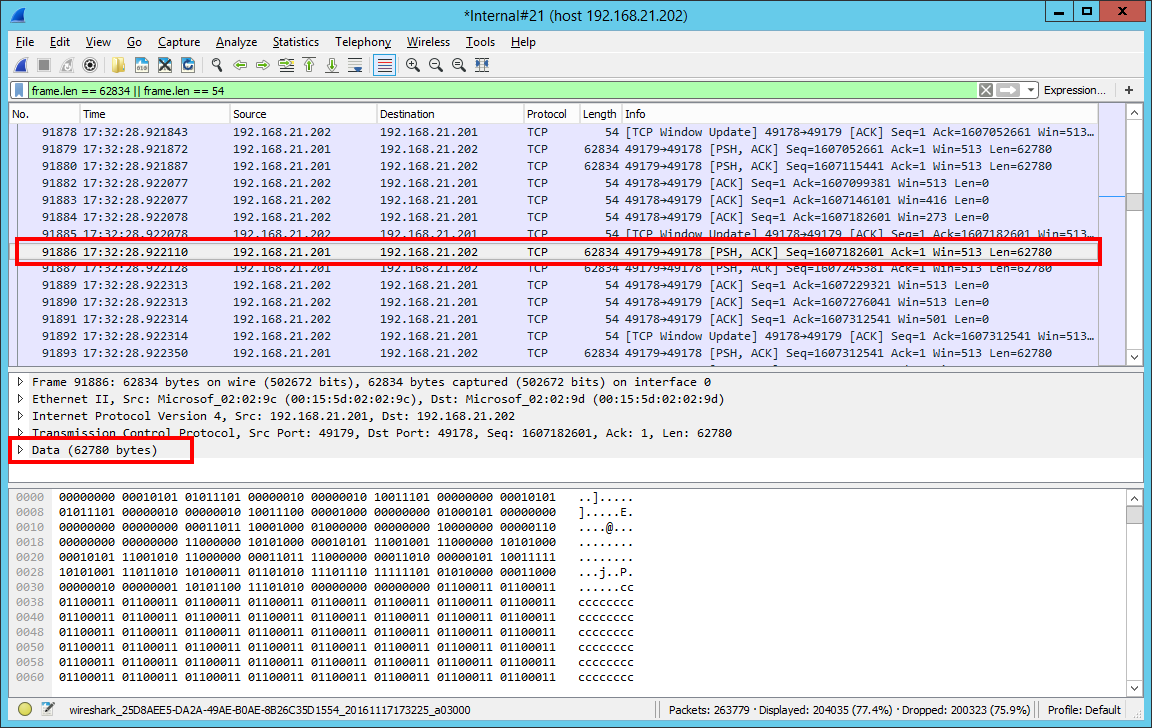
The IOmeter [62780 B; 0% Read; 0% random] benchmark test purpose is to help us reproduce the SMB of HTTP(S) traffic. In our file share and IIS network traffic analysis we saw the largest recorded frames are in size of 62834 bytes (from where ETH=14 bytes, IP=20 bytes, TCP=20 bytes and TCP data=62780 bytes). This benchmark test will make IOmeter send over the network a lot of 62780 bytes write operations. So, to some extent, we can say we reproduce / simulate a “file share” or “IIS” server on steroids who is always sending data over the network (and always running at the maximum).
1460 B; 100% Read; 0% random (1460 Bytes transfer request size, 100% read distribution, 0% random distribution)
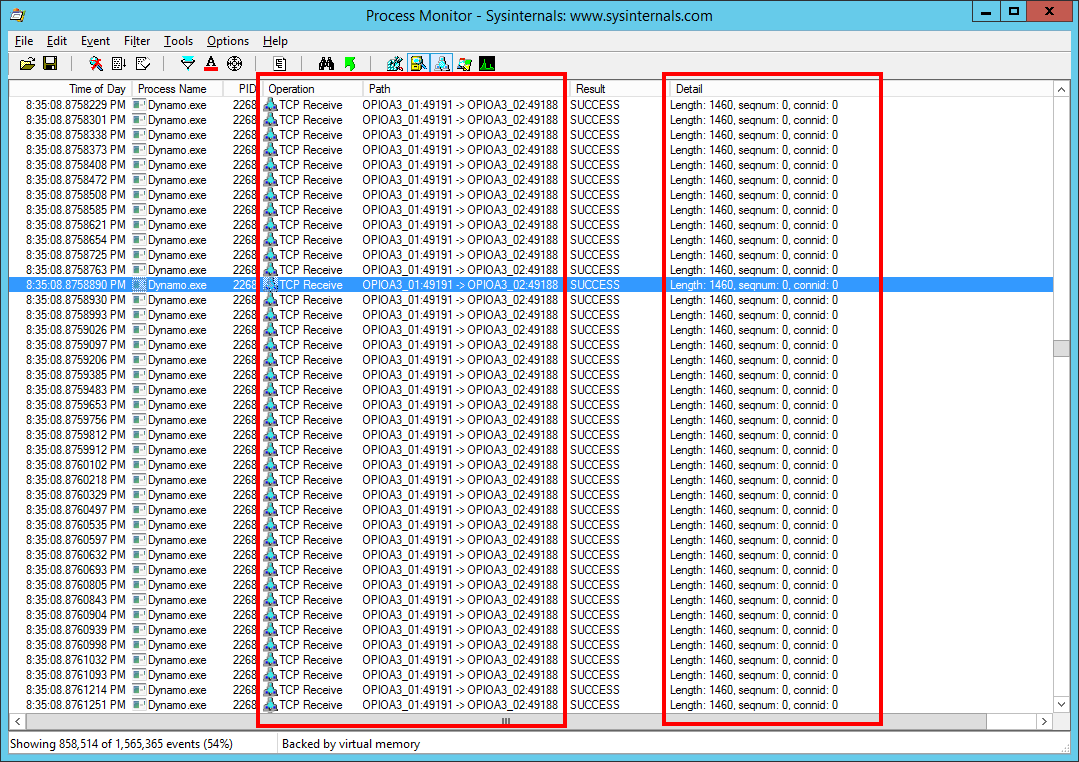
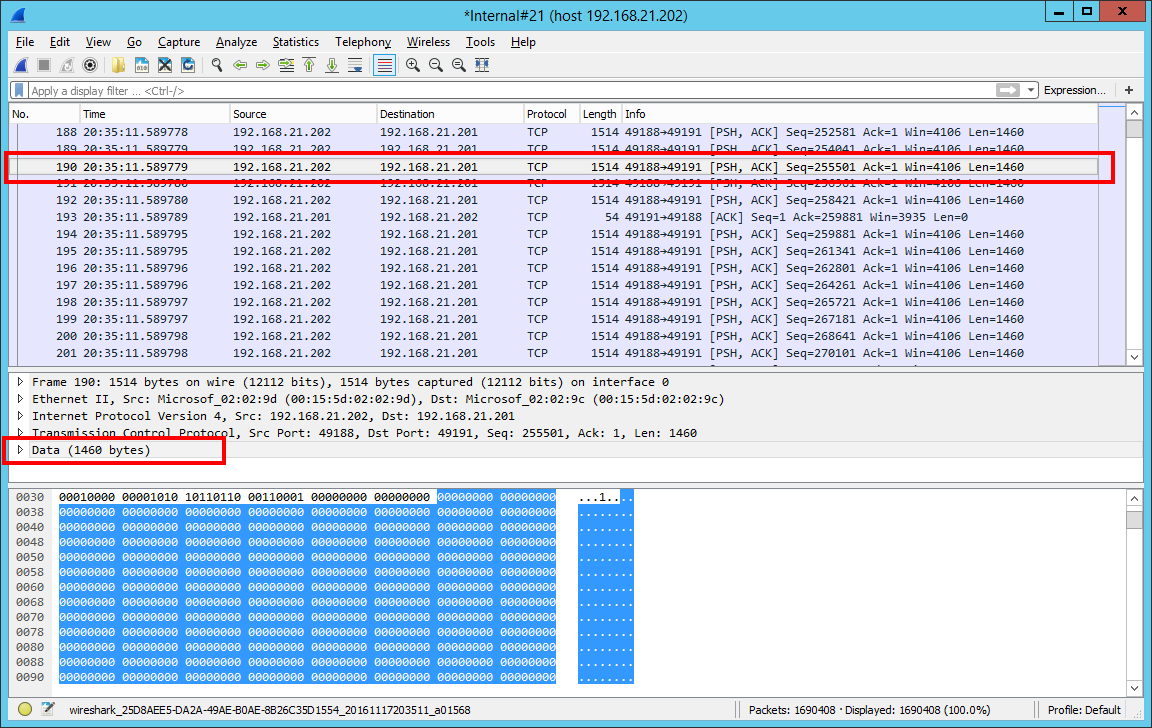
The last IOmeter [1460 B; 100% Read; 0% random] benchmark test is to help us reproduce the traffic a client machine receives over the network. In all our protocol analysis we saw no matter how much amount of data the server was sending to the network adapters, over the network the data was divided based on the Maximum Transmission Unit size. So this tests will actually show the performance we can achieve by having both endpoints (server and the client) communicating by default with 1460 bytes chunks in such way the network packet to be in size of 1500 bytes, size who is matching the MTU value (IP=20 bytes + TCP=20 bytes + TCP data=1460 bytes = 1500 bytes).
In this case, the maximum frame size expected to see in Wireshark is 1514 bytes (from where ETH=14 bytes, IP=20 bytes, TCP=20 bytes and TCP data=1460 bytes). So, to some extent, we can say we reproduce / simulate a client on steroids who is always receiving data over the network (and always running at the maximum network capacity).
