This article is part of a series of 5 where I am talking about the Microsoft Azure network bandwidth. For a better understanding please make sure you read also the other parts:
- What does Microsoft mean by low / moderate / high / very high / extremely high Azure network bandwidth (part 1)
- The isolated network setup (the environment used for network analysis) (part 2)
- What happens when we perform a PING? (part 2.1)
- What happens when we perform a PING in size of 4086 bytes? (part 2.2)
- Now let’s see what exactly happens when a file is copied over the network (file share) (part 2.3)
- Now let’s see what exactly happens when MS SQL traffic is performed (part 2.4)
- Now let’s see what exactly happens when IIS HTTP/HTTPS traffic is performed (part 2.5)
- The IOmeter benchmark tests who reproduce as close as possible the HTTP/HTTPS, SMB and MS SQL network traffic (part 3)
- The Azure Virtual Machines used to run the IOmeter benchmarks (part 4)
- Results and interpretations
What happens when we perform a PING?
Please note when a PING is performed the default amount of data (ICMP data) passed between the systems is 32 bytes.
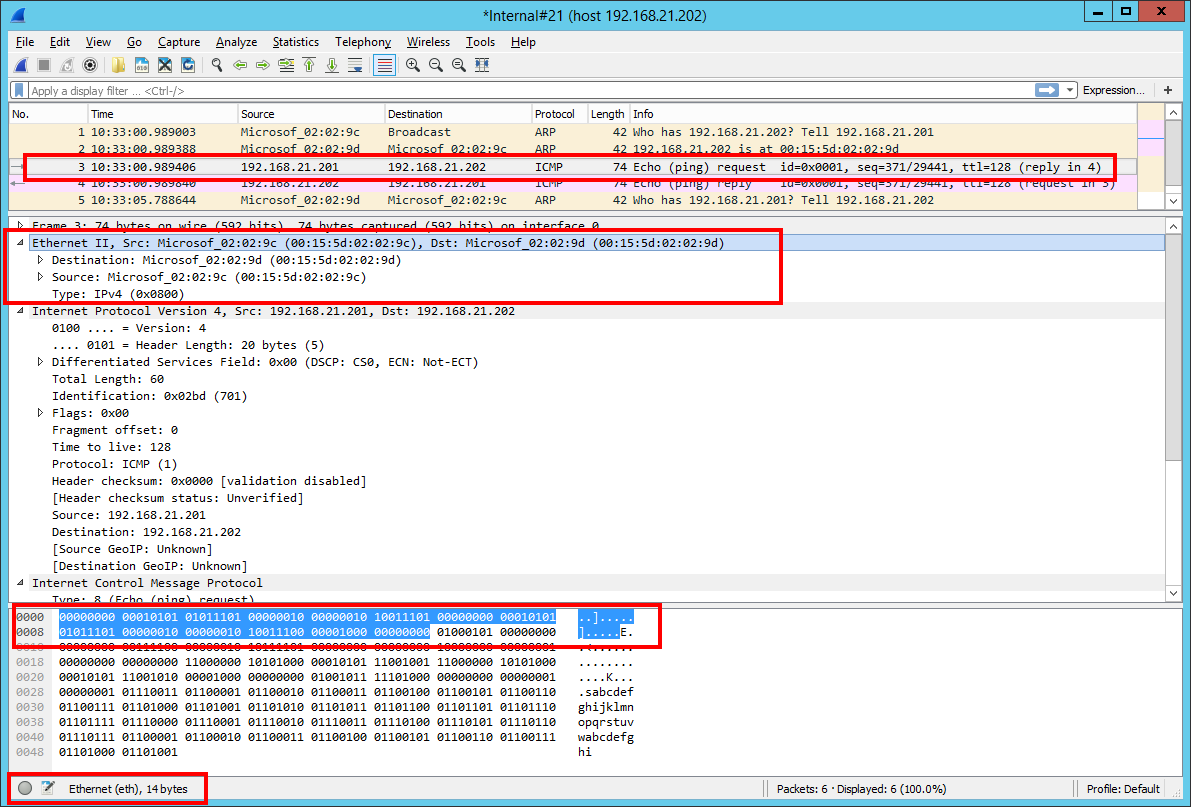
In the next image you can see how Wireshark is representing the network traffic – in this case with red is highlighted the frame associated to the PING echo request.
ETH = 14 bytes
count the number of bytes marked with blue at the bottom of this picture (Wireshark’s Packet Bytes window section)
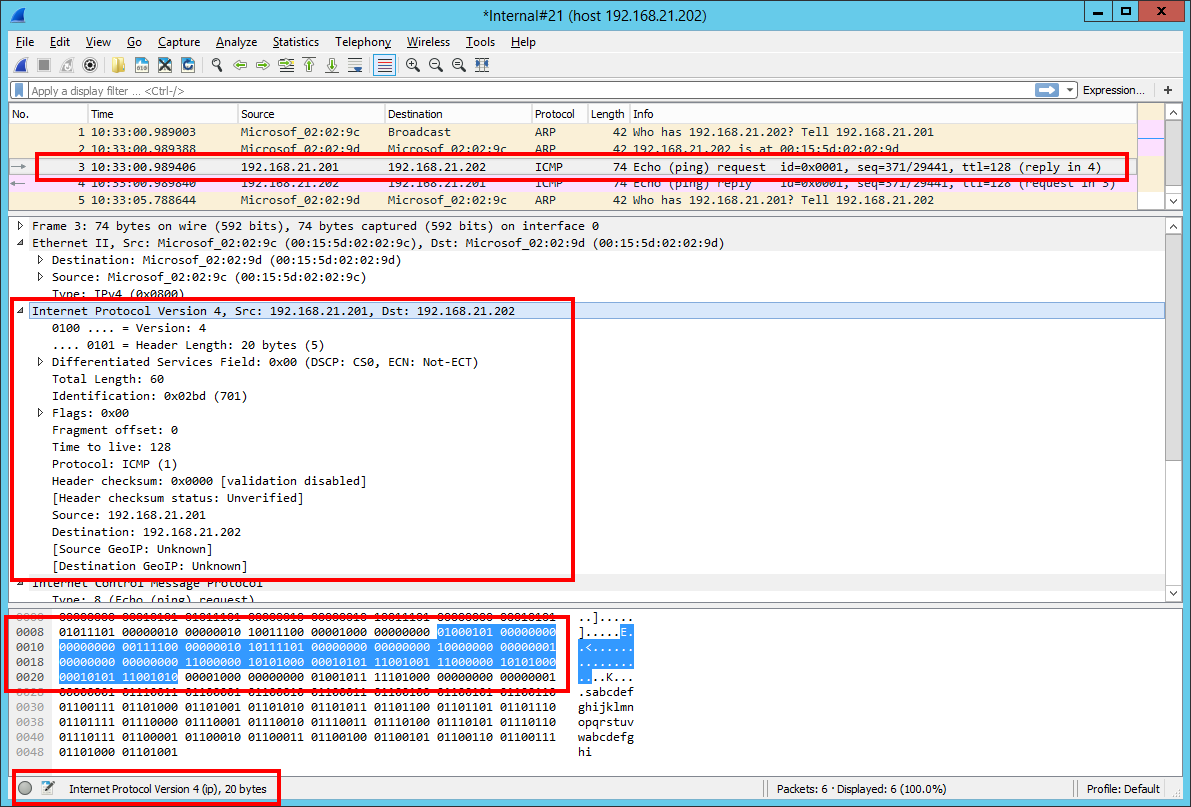
IP = 20 bytes
count the number of bytes marked with blue at the bottom of this picture (Wireshark’s Packet Bytes window section)
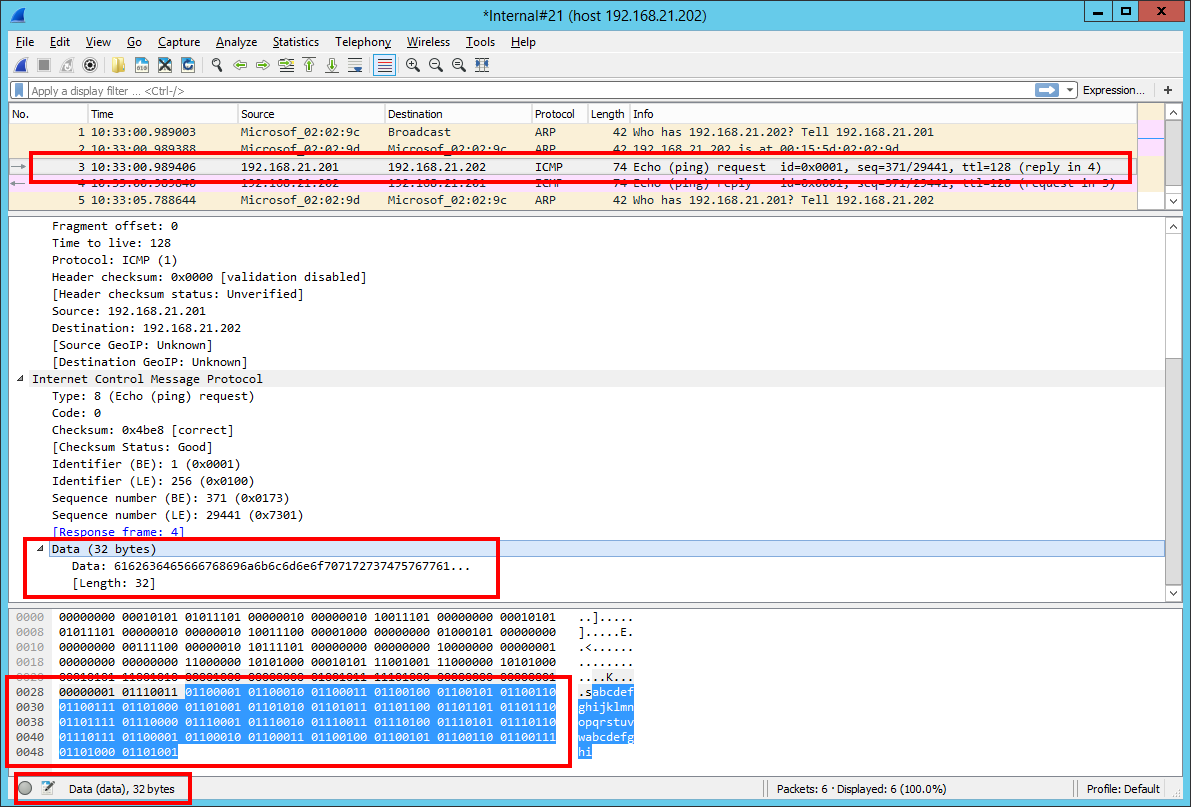
ICMP data = 32 bytes
count the number of bytes marked with blue at the bottom of this picture (Wireshark’s Packet Bytes window section)
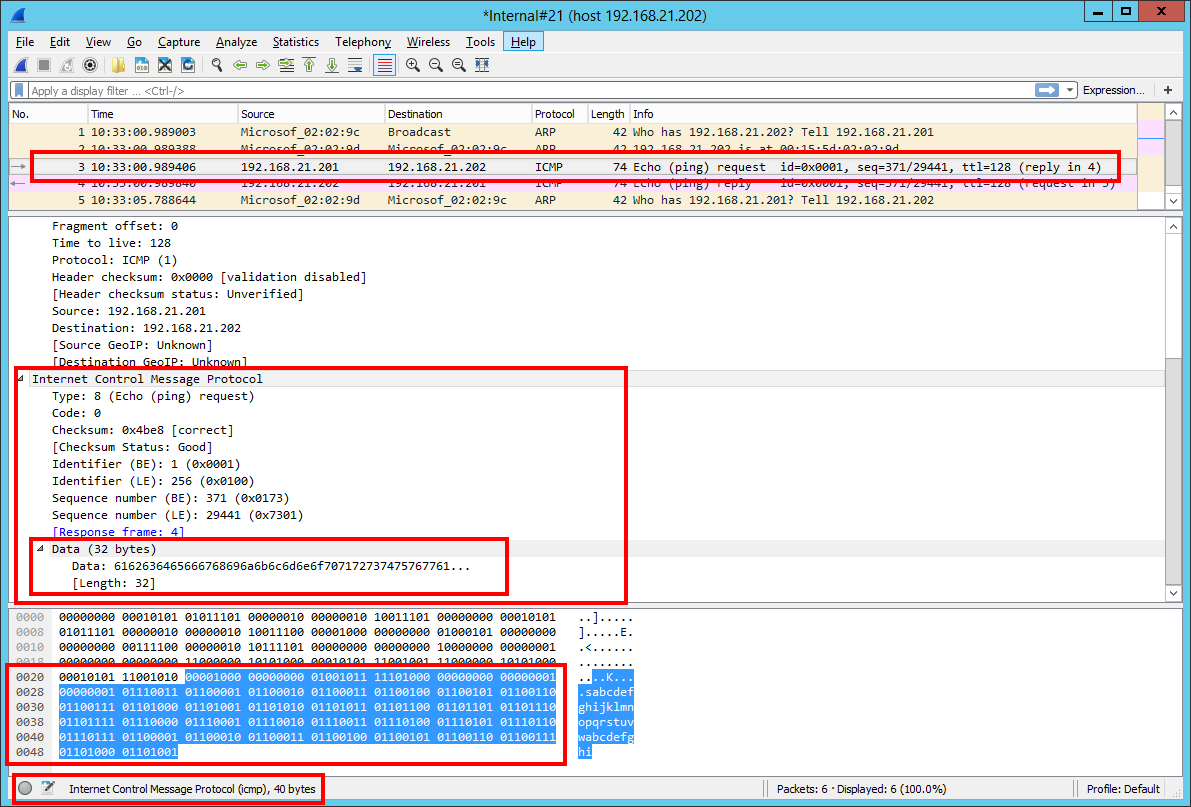
ICMP = ICMP header + ICMP data
40 bytes = ICMP header + 32 bytes
ICMP header = 40 bytes – 32 bytes
ICMP header = 8 bytes
So, in the end we can say Wireshark represents this PING echo request as a single frame in total size of 74 bytes where:
- ETH size = 14 bytes
- IP size = 20 bytes
- ICMP header = 8 bytes
- ICMP data = 32 bytes


