This article is part of a series of 5 where I am talking about the Microsoft Azure network bandwidth. For a better understanding please make sure you read also the other parts:
- What does Microsoft mean by low / moderate / high / very high / extremely high Azure network bandwidth (part 1)
- The isolated network setup (the environment used for network analysis) (part 2)
- What happens when we perform a PING? (part 2.1)
- What happens when we perform a PING in size of 4086 bytes? (part 2.2)
- Now let’s see what exactly happens when a file is copied over the network (file share) (part 2.3)
- Now let’s see what exactly happens when MS SQL traffic is performed (part 2.4)
- Now let’s see what exactly happens when IIS HTTP/HTTPS traffic is performed (part 2.5)
- The IOmeter benchmark tests who reproduce as close as possible the HTTP/HTTPS, SMB and MS SQL network traffic (part 3)
- The Azure Virtual Machines used to run the IOmeter benchmarks (part 4)
- Results and interpretations
- 4096 B; 0% Read; 0% random (part 5.1)
- 62780 B; 0% Read; 0% random (part 5.2)
- 1460 B; 100% Read; 0% random (part 5.3)
Results for the 62780 B; 0% Read; 0% random (62780 Bytes transfer request size, 100% write distribution, 0% random distribution) benchmark
Frame size for a single network I/O operation => 14 bytes (ETH) + 20 bytes (IP) + 20 bytes (TCP) + 62780 bytes (TCP data) = 62834 bytes (0.08% protocol overhead and 99.92% data)
Packet size for a single network I/O operation => 20 bytes (IP) + 20 bytes (TCP) + 62780 bytes (TCP data) = 62820 bytes
Low vs Moderate vs High
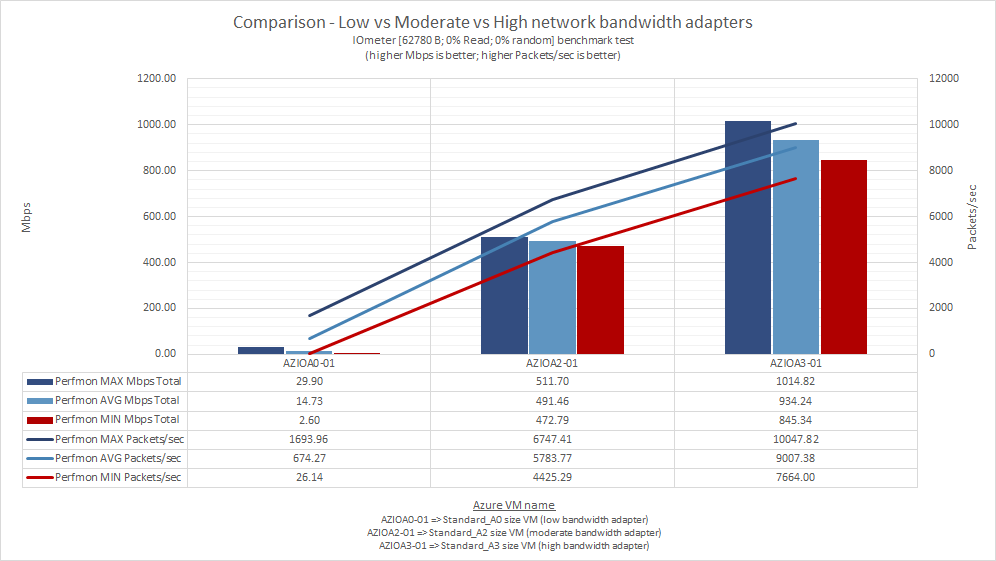
So, this time the amount of I/O data was increased around 15 times (compared with the previous benchmark test), but the results are very similar:
- Azure Low bandwidth performance is around ≈30 Mbps total (send & receive);
- Azure Moderate bandwidth performance is around ≈500 Mbps total (send & receive);
- Azure High bandwidth performance is around ≈1 Gbps total (send & receive);
Please note the numbers based on which this chart has been generated have been collected using Performance Monitor.
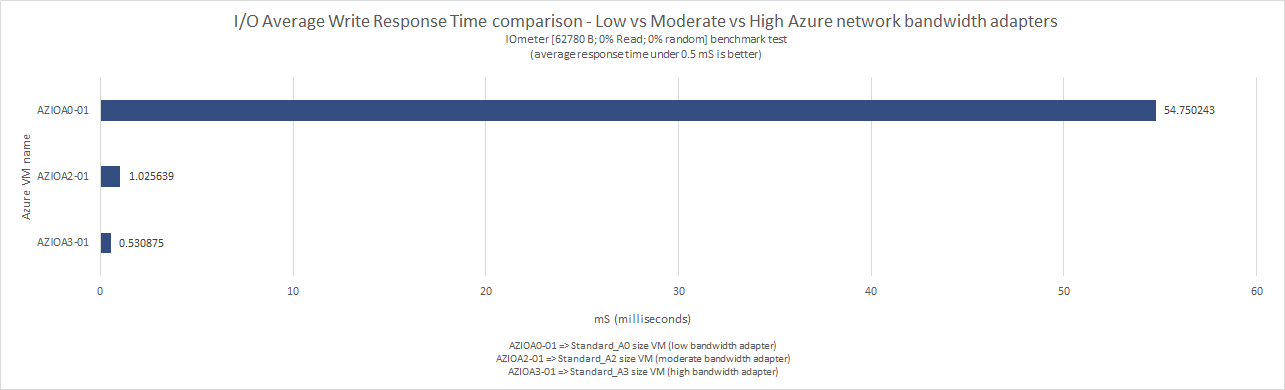
The above chart indicates the average write response time IOmeter recorded for the [62780 B; 0% Read; 0% random] I/Os. Comparing with the results from previous benchmark test, we can see a considerable time increase for the Azure Low bandwidth network – sign that this type of network bandwidth should be considered for those applications where the network packet data size is small.
These numbers are provided by IOmeter and are registered when the network is saturated.
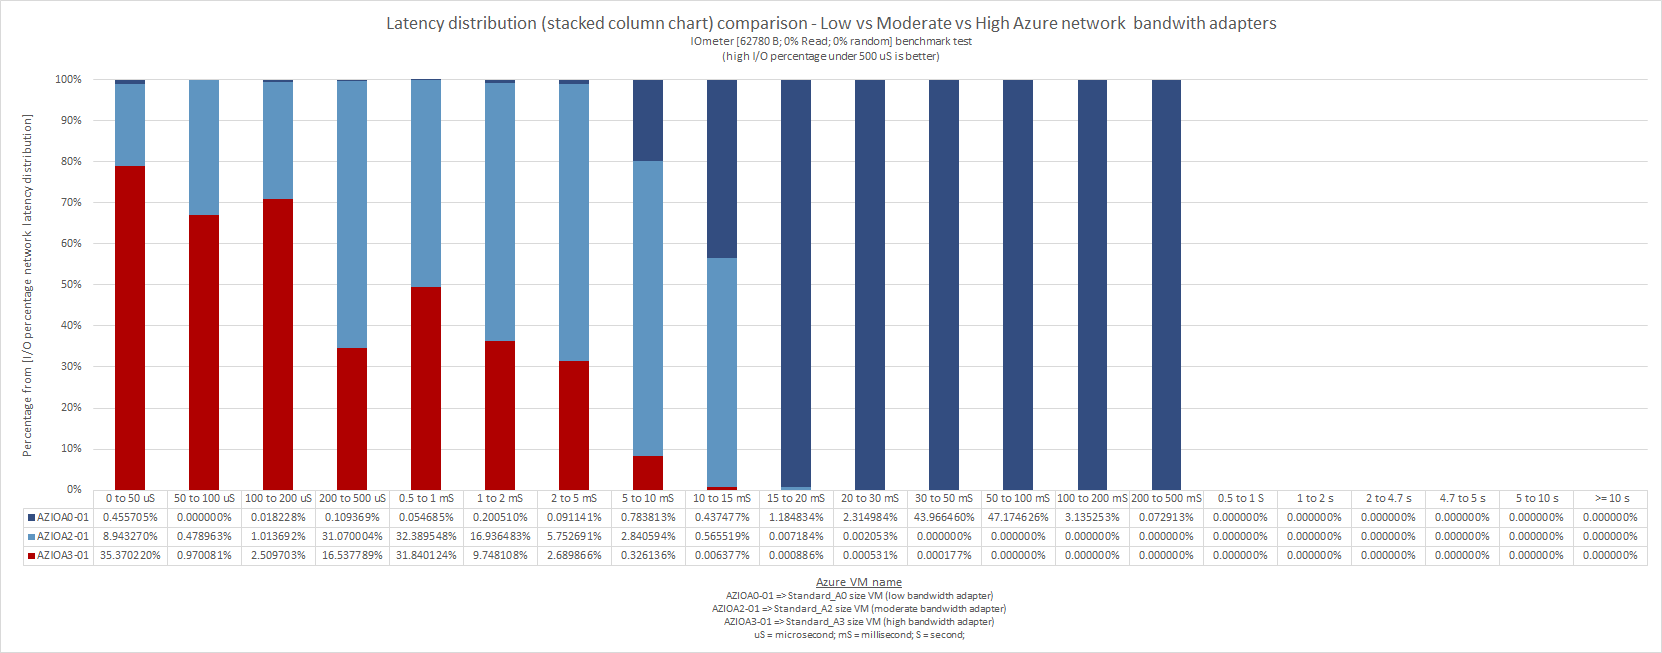
The above stacked column chart represents the latency distribution for the [62780 B; 0% Read; 0% random] IOmeter benchmark. The best performer is Azure High network bandwidth (AZIOA3-01), followed by Azure Moderate (AZIOA2-01) and Azure Low (AZIOA0-01) network bandwidth.
This chart is a very good network performance indicator. Comparing these results with the previous benchmark test, we can clearly see how much the I/O size is influencing the latency.
High vs Very High vs Extremely High
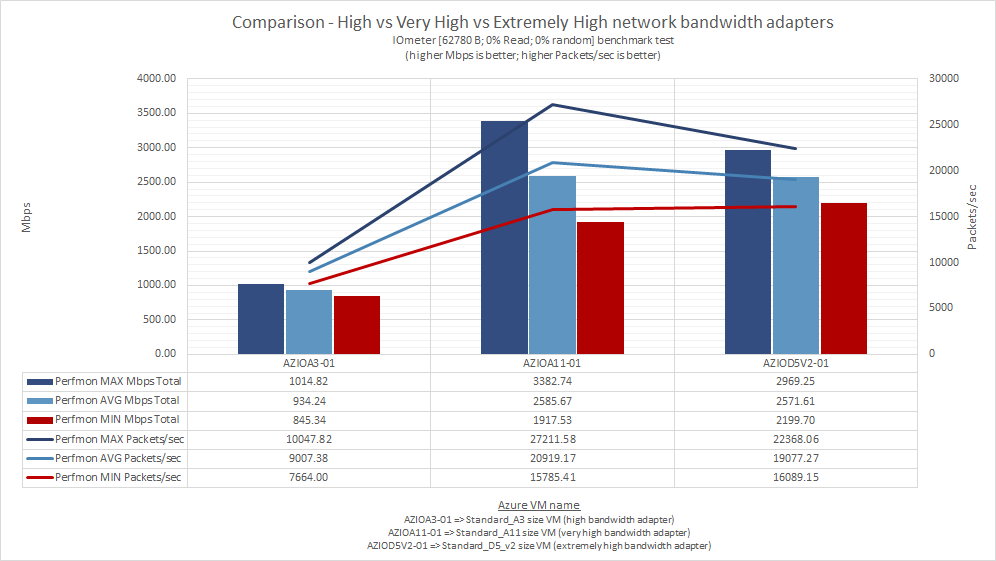
We can see there is a clear difference in performance between Azure High and Azure Very High or Extremely High network bandwidth adapters. Microsoft is not providing what exactly these network bandwidths means, but from the [62780 B; 0% Read; 0% random] IOmeter benchmark results, we can say:
- Azure High bandwidth performance is around ≈1 Gbps total (send & receive);
- Azure very high bandwidth performance is around ≈3.3 Gbps total (send & receive);
- Azure extremely high bandwidth performance is around ≈3 Gbps total (send & receive);
Looking at the average speeds registered by Azure Very High and Azure Extremely High network bandwidths, I tend to say again – there is not that much difference between them in terms of performance (same conclusion as for the [4096 B; 0% Read; 0% random] results).
Please note the numbers based on which this chart has been generated have been collected using Performance Monitor.
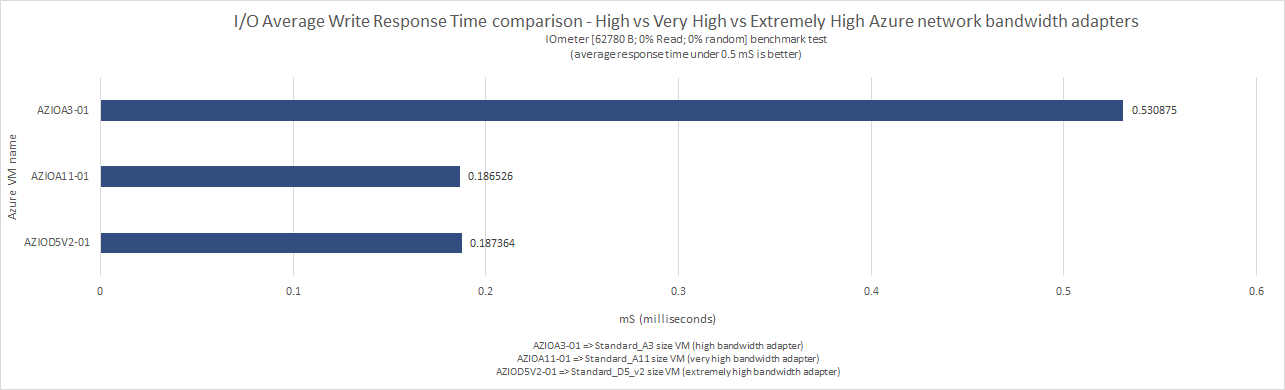
AZIOA03-01 (Azure High network bandwidth) registered a response time a bit over 500 microseconds (0.5 mS). The other two registered good write response times and can handle very well the network traffic even when the network is saturated with this type of traffic ([62780 B; 0% Read; 0% random]).
As noticed also in the previous chart, there is a clear difference in performance between Azure High and Azure Very High or Extremely High, but the last two are not much different one from the other.
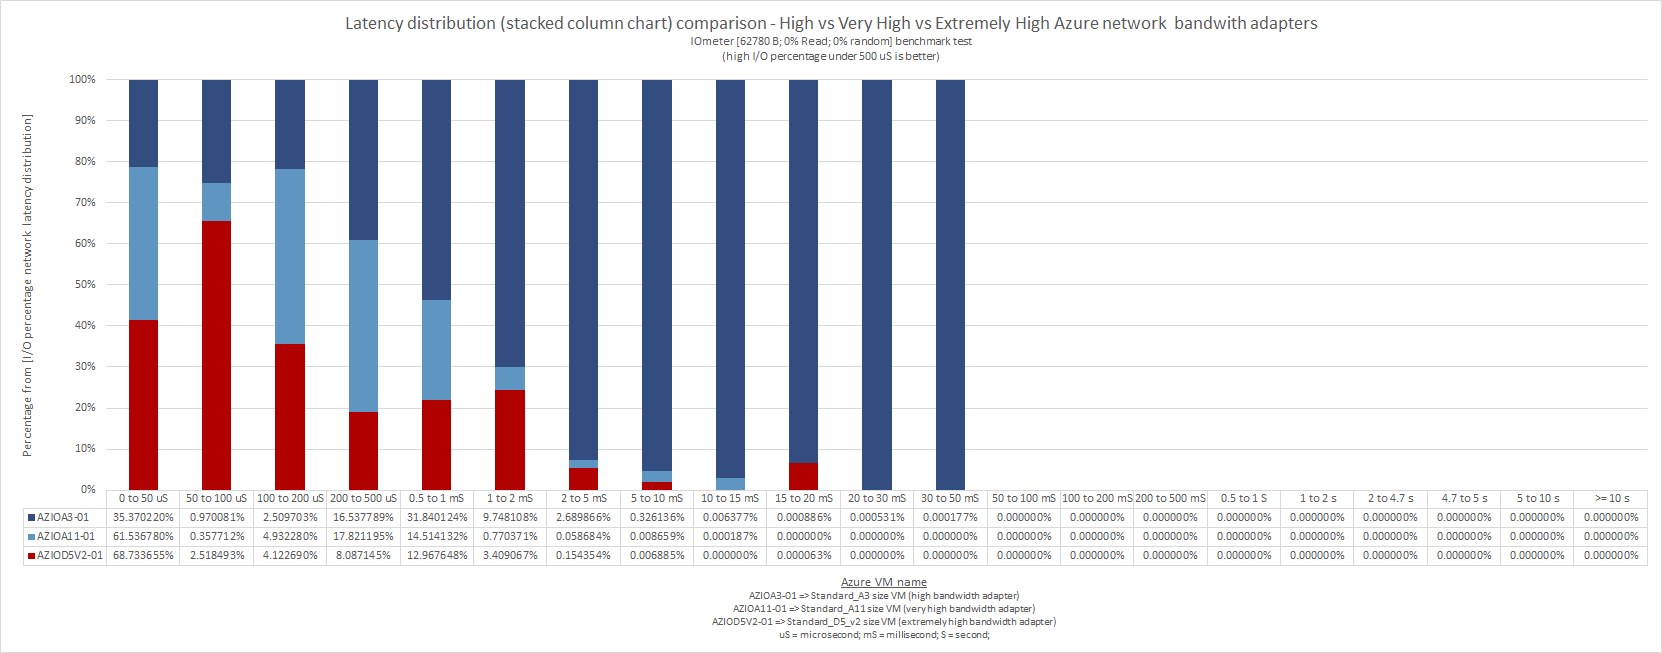
If we look at the latency distribution chart, the best performer is Azure Extremely High network bandwidth, followed by Azure Very High and Azure High.
With this type of I/O we can see some differences between Azure Extremely High and Azure Very High networks, but I am not convinced if an upgrade from Very High to Extremely High will actually make the difference in case you encounter network bottlenecks with Azure Very High network bandwidth. In that case I would advise upgrading to an Azure Very High RDMA capable VM, but keep in mind the second network interface for remote direct memory access (RDMA) does not provide general TCP/IP connectivity (it can be used only by applications who can “talk” over Network Direct interface and MPI protocol).